Get 40% Off
👀 👁 🧿 All eyes on Biogen, up +4,56% after posting earnings. Our AI picked it in March 2024.
Which stocks will surge next?
Unlock AI-picked Stocks

The Energy Sector’s Big Rally May Soon Fade

Published 05/14/2021, 05:07 AM

This article was written exclusively for Investing.com

As measured by the Select Sector SPDR ETF XLE, energy stocks have been the hottest group in the S&P 500 this year. The ETF is up more than 35% on the year, but that significant advance seems poised for a change in direction. Suddenly, oil appears to be weakening as higher coronavirus cases rise in different parts of the world. 

The ETF has struggled to get through some challenging levels of resistance. That has resulted in options traders betting on a reversal in the sector as well. The trends suggest that the sector and oil may have peaked for the short term and is likely to see much lower prices in the weeks ahead. 

Energy Stocks To Drop?

Earlier this week, there was a considerable increase in the open interest levels for the XLE June 18 $55 puts. The number of contracts increased by more than 23,000 on May 12. When digging into the data, it showed a spread trade, with a trader buying the puts. In all, they paid about $2.60 in total for the transaction. It would indicate that the XLE is trading below $52.40 by the expiration date. The more the ETF falls, the greater the trader's profit.

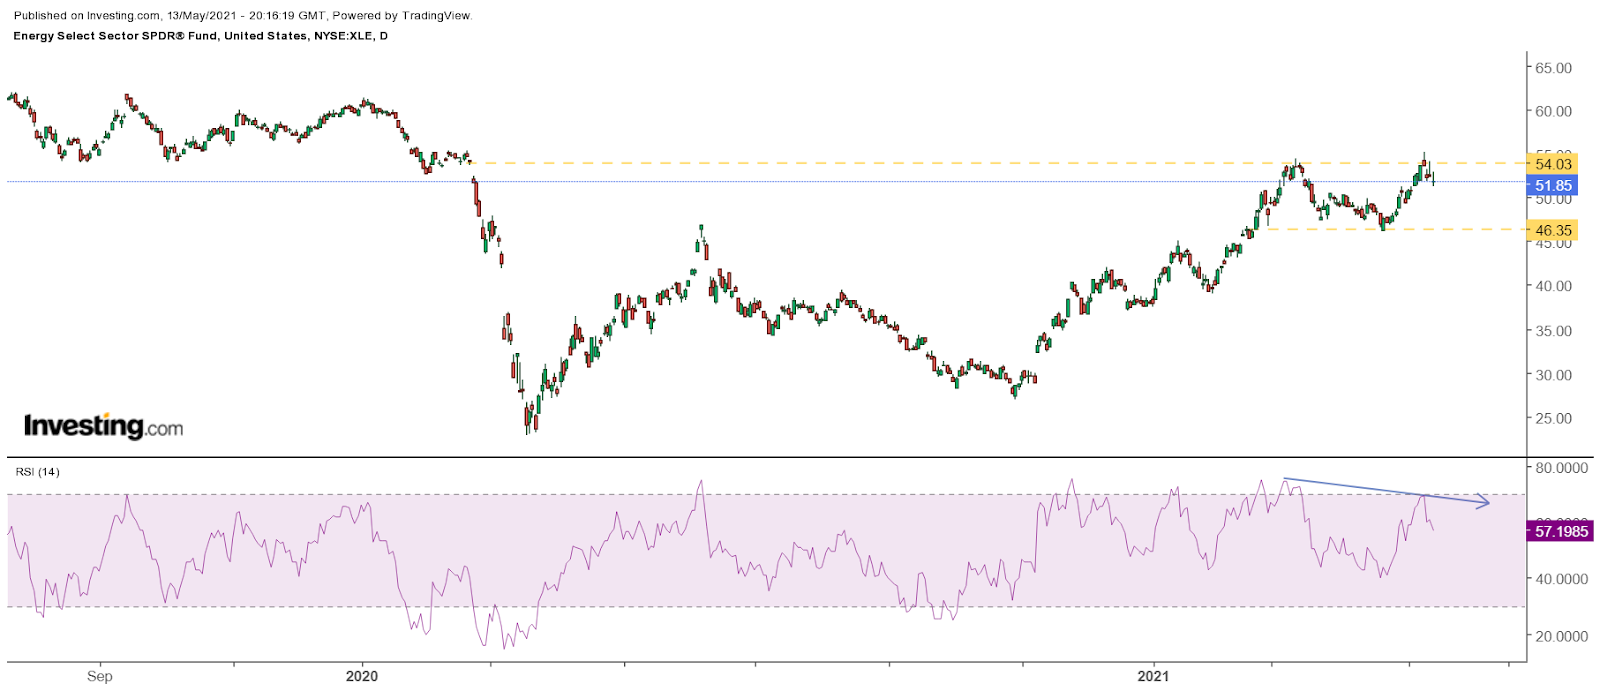
At the end of the day on May 13, the XLE was already trading below $52.40, at roughly $51.90. There are indications based on the technical chart that suggests lower prices may be coming for the XLE. Recently, the ETF has failed, for the second time, to rise above a significant level of resistance at $53.50. The first time it failed at that level was in the middle of March. Currently, the ETF is approaching support at $50. A break of that support level is likely to result in the XLE falling to around $46.35, a drop of almost 10%.
3rd party Ad. Not an offer or recommendation by Investing.com. See disclosure here or remove ads .

XLE Daily

The relative strength index has been heading lower since peaking in March with a level above 70. However, the RSI has recently made a lower high, despite the ETF making a slightly higher high. This is a negative pattern known as a bearish divergence. It is signaling that the XLE has more to fall before finding a bottom. 

Oil's Falling Too

The recent weakness in the XLE stems from the current slide in oil, which shows many of the same technical trends as the XLE—oil has struggled and has been unable to rise above $67 per barrel. Despite many of the headlines of inflationary pressure taking place across the economy, oil prices have been stuck. Additionally, the RSI on oil has been showing the same bearish trends as the XLE and would indicate that a drop back to $57 is likely. 
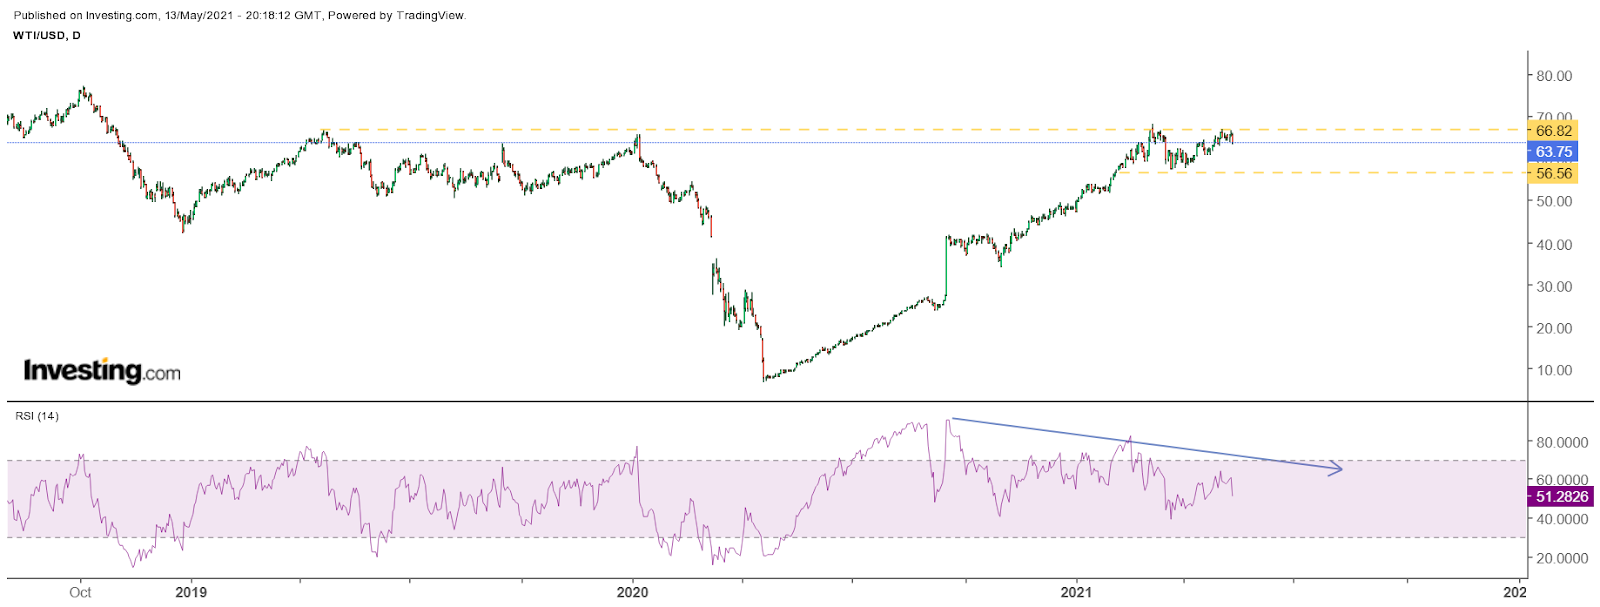
WTI/USD Daily

Clearly, the sector's strong performance calls for a pause or, at the very least, a modest pullback. While it seems entirely too early to think that the energy sector is likely to enter a prolonged or protracted decline, it is worth considering that there may be further for the sector to fall over the near term. 

The longer-term outlook will be determined by the health of the economy and its recovery from the coronavirus pandemic. If life essentially returns to normal in the months ahead, it is likely to lead to increased needs for energy and oil products. 

Latest comments

Thanks for another interesting article Michael, I always look for your articles because I enjoy your insight!
US and most European countries announced no masks for vaccinated people, economies are opening so what are you talking about here 🙄
Natural gas will drop to nothing with in few weeks.
Garbage article from a bear
Naing ko
this is such garbage, covid cases are dropping and the economies are opening, there is about to be a war in the middle east etc are you stuck in 2019?
Actually... let me use the charts you posted... Here is crude oil versus the XLE... around 33% lower.... and its much worse for the XOP... about 75% lower
gm I love this
This is one of many examples of an energy stocks that, in comparison to the price of oil, have really not rallied at all.  they, in fact, have been left behind in the dust.
Apparently somebody hasemought conviction to buy 20k puts at riding to bet that oil,s near term trend is down longer Tim ,sure,wti is going beyond 100,
I see a triple top and a demand that will never reach prepandemic levels. Add to that every producer in the world is raising production, OPEC+ exceeding their quotas by 3 mbd. Tou funny, cup and handle. Your toast.
Apparently somebody hasemought conviction to buy 20k puts at riding to bet that oil,s near termtrend is down longer Tim ,sure,wti is going beyond 100
"When digging into the data, it showed a spread trade, with a trader buying the puts. In all, they paid about $2.60 in total for the transaction. It would indicate that the XLE is trading below $52.40 by the expiration date." It indicates no such thing. You have no idea what the trade strategy is here.
Look I completely disagree with you 100%. .
hi
Short term maybe... longer term i love oil. Will be buying XOM calls far dated
Apparently somebody has enough conviction to buy 25k puts (at writing) to bet that oil's near term trend is down. Longer term, sure, WTI is going beyond 100.
Your funny
hi
I see a double bottom and a cup and holder. IMHO this is buying opportunity. Dont look weekly move oil in a month will be at all time high with virus in control in US and peaking in India. Dont be fooled by this writer.
I see a triple top.
You are clueless, the cashflows from the E&P companies right now are not paralleled by any other sector, and the multiples are still no where the historical highs
Actually we need people like you to short the sector so we can get a beautiful short squeeze
they are about to break out of resistance, but jokes aside thanks for the opposing view
After 3 days skyrocket and who read this will stay out
lmao....
Risk Disclosure: Trading in financial instruments and/or cryptocurrencies involves high risks including the risk of losing some, or all, of your investment amount, and may not be suitable for all investors. Prices of cryptocurrencies are extremely volatile and may be affected by external factors such as financial, regulatory or political events. Trading on margin increases the financial risks.
Before deciding to trade in financial instrument or cryptocurrencies you should be fully informed of the risks and costs associated with trading the financial markets, carefully consider your investment objectives, level of experience, and risk appetite, and seek professional advice where needed.
Fusion Media would like to remind you that the data contained in this website is not necessarily real-time nor accurate. The data and prices on the website are not necessarily provided by any market or exchange, but may be provided by market makers, and so prices may not be accurate and may differ from the actual price at any given market, meaning prices are indicative and not appropriate for trading purposes. Fusion Media and any provider of the data contained in this website will not accept liability for any loss or damage as a result of your trading, or your reliance on the information contained within this website.
It is prohibited to use, store, reproduce, display, modify, transmit or distribute the data contained in this website without the explicit prior written permission of Fusion Media and/or the data provider. All intellectual property rights are reserved by the providers and/or the exchange providing the data contained in this website.
Fusion Media may be compensated by the advertisers that appear on the website, based on your interaction with the advertisements or advertisers.
© 2007-2024 - Fusion Media Limited. All Rights Reserved.