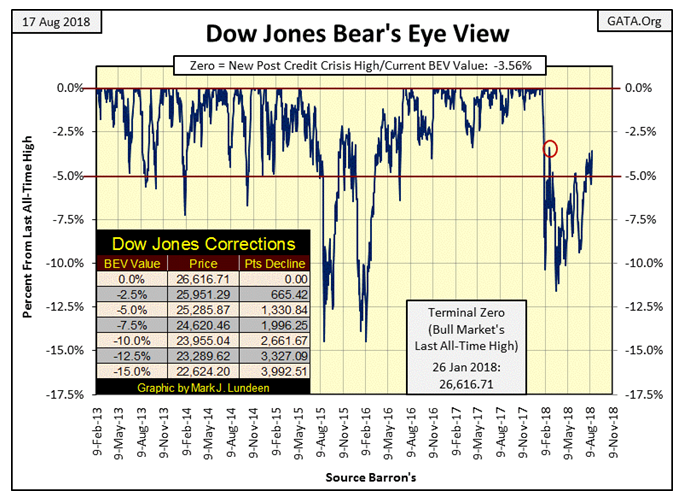
The Dow Jones did good this week, closing just a hair from its February 26th’s -3.41% (Red Circle below). Hopefully it can take that out next week, but who can say whether it will or not? So let’s all cross our fingers and hope for the best.

I’m not risking my money in this market, and it’s more enjoyable being bullish than bearish. So when I say the Dow Jones could make a few more new all-time highs (BEV Zeros) in the BEV chart above, I’m not lying; it could really happen. And knowing that makes people feel good about themselves and the world they live in, why shouldn’t I point this out. Isn’t that what market prognostication all about?
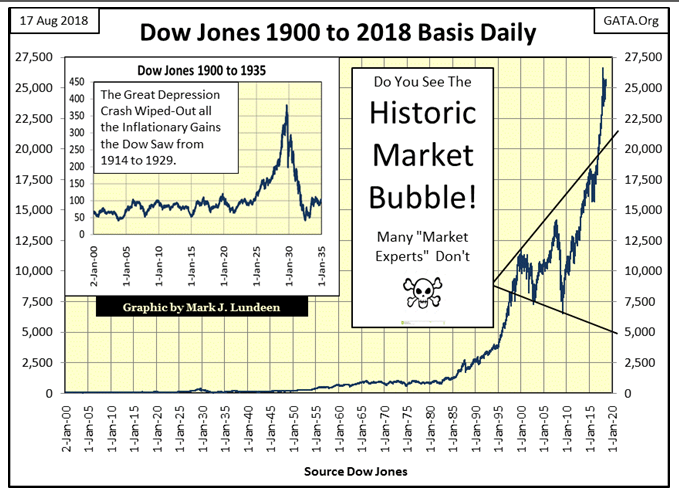
The other choice I have is to say what I really think about the stock market andrisk losing some of my friends. For instance look at the chart below; in August 1971, when the Dow Jones was only about 860, they (you know who THEY are) decoupled the dollar from the Bretton Woods’ $35 gold peg. Since then our “policy makers” have inflated a series of humongous bubbles in the stock& debt markets.
I have to admit the “policy” which accomplished these inflated market values was skillful. What “market expert” or Keynesian economists wouldn’t be proud to show the public this chart as proof positive how decoupling the dollar from gold many decades ago has allowed the markets to experience amazing “growth.” That would be especially so of the stunning gains seen after the March 2009 bottom of the 2007-09 sub-prime mortgage debacle.

There’s no shortage of historical books on the market citing the specifics how the “policy makers” did the same thing during the 1920s, as plotted in the insert in the chart above. When that bubble began deflating it was called the Great Depression crash, an 89% market decline that wiped clean all the gains the Dow Jones had made since 1914.
Forty-seven years have passed since August 1971; five decades of inflating values in the stock market that saw the Dow Jones rise up from 860 to over 26,000 in January 2018. Five decades that also saw credit creation and debt growth take the US national debt from $400 billion to over $21 trillion dollars. That’s a bubble too, and ultimately bubbles deflate or continue inflating until the unit-of-account they are denominated in becomes worthless.
To read the entire report Please click on the pdf File Below:
