
The risk rally ignited by the blinking of Fed’s Powell and further supported by the easing in China after the PBOC announced a 1% RRR cut to its banks, continues to underpin risk assets. The underperformance of the Japanese yen, now well below its pre-flash crash levels, portrays the improved picture, even if the cynic within me, still tells me we are far from being out of the woods.
The reason I am adamant to place too much weight on a protracted relief rally is that I still have very present in my mind where we come from in late 2018. One of the ugliest December equity sell-off ever, U.S. companies’ earnings estimates to follow Apple Inc (NASDAQ:AAPL)'s downgraded guidance, a oil exchange rate that still screams a low growth/deflationary environment, a record-high move into U.S. money markets, just to name a few. As an analogy, the current recovery in risk assets still feels like too minuscule and with a few major hurdles to overcome before a more convincing phase can take shape.
Fed’s Powell has caused technical damage to overblown risk-off extensions, but as I argued in yesterday’s report, the Fed will still need to transition from a mere dovish stance about its readiness to act and adjust its balance sheet to more dovish action. Even if the market buys into the idea that the Fed tightening campaign is clearly over (no more hikes priced in this year), the Central Bank needs to follow up with the type of signals that will keep the market’s hopes of a slowdown in QT alive. If you check today’s 25-delta risk reversals updates (provided below), it should be concerning that the premium to buy Puts on the E-mini S&P 500 keep rising as the correction higher continues. Similarly, the Calls in U.S. fixed income seem to be reverting back up, now more expensive than the Puts again, after a brief spell in which Fed’s Powell interview caused the pricing to even out.
The weak U.S. PMI, which follows a broader negative theme worldwide, Apple’s miss unlikely to be an isolated incident, recently extreme equity valuations, a housing market in trouble must still contend with residual strong U.S. economic data emanating from the jobs market or consumers’ consumption. So, while we’ve been offered the first catalyst courtesy of Powell to see risk premiums come down, the process of reckoning the true risks of a deterioration in the U.S. economy may end up being a slow process, with the pendulum swinging from optimism to pessimism.
All the walk-back the Fed has done ever since Chairman Powell told us that U.S. rates were at a significant distance from neutral to now even consider adjusting the Fed’s balance sheet, draws a clear trend. One that is starting to show some clear cracks via the USD index, as it threatens a major technical breakout after closing at the bottom of its multi-month range circa 95.70, just as the EUR/USD keeps re-aligning itself with its higher macro valuation based on the German vs U.S. yield spread. It’s still too early to claim victory by the bulls, but the highest close in the EUR/USD in the entire duration of its torturous range is a pretty negative presage for the USD worth monitoring.

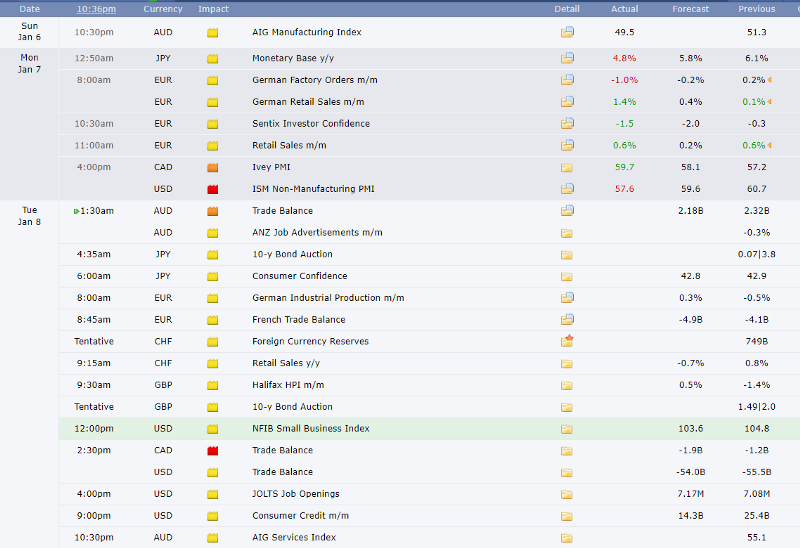
The undershoot in the U.S. December ISM non-manufacturing PMI at 57.6 vs 59.00 exp on Monday adds to the growing worries that the U.S. economy may start limping of one leg, as it occurs just days after we learned that the U.S. ISM manufacturing PMI saw one of its sharpest drops on record. As a reminder, statistically, last week’s miss in the key manufacturing data out of the U.S. heightens significantly the chances of a potential recession in the U.S. as the economic cycle falters. As a consolation, today’s U.S. ISM non-manufacturing data saw a minor uptick in new orders which still argues for residual demand.
In Europe, after a weakening trend in the EZ CPI last Friday, even if expected on the back of the massacre suffered by oil prices, we had to contend with another very poor showing in German factory orders. The release further cements the downward trend in manufacturing read we are seeing across major countries and places the ECB in a very difficult position to be the next one to follow the Fed’s step and blink on its intentions to normalize the policy this year. A positive German retail sales reading on Monday, far exceeding expectations, felt like not enough to offset the negatives.
A currency that has started 2019 on a tear, which comes in stark contrast to its depressive performance from late 2018, is the Canadian dollar. The last economic data release — Ivey PMI — at 59.7 vs 57.2 stands out as quite impressive considering the trend was seen elsewhere.
Whether or not the CAD outperformance keeps on going, will be highly dependable on tomorrow’s BoC policy meeting, with the market recently starting to price in the chances of a rate cut in ‘19.
Allow me to quote Adam Cole, Chief Currency Strategist at RBC Capital Markets, and its take:
We are in line with the consensus in seeing no change in the overnight rate on January 9th. Financial market developments have been huge in the month since the December confab, with 2-, 5- and 10-year yields all ~30bp lower in the broad global risk-off move. Governor Poloz & Co. were noticeably more dovish at the December meeting and associated economic progress report, highlighting risks from lower oil prices and the possibility of an output gap re-emerging due in part to GDP revisions and softer Q3 GDP details. Near-term growth looks to be soft at just over 1%, with oil production curtailments and a postal strike weighing. We do expect GDP growth beyond to be at or above potential and see 2019 at 1.7% overall. Combined with underlying inflation remaining around 2%, this should be enough to see two hikes later this year.
Economic Calendar
Charts Insights: What Are You Missing?
EUR/USD — The Most Bullish It’s Been For Months

The USD weakness playing through after Powell’s Put is evident in the valuation of the euro. While I’ve argued that I simply can’t envision the multi-month range to be decisively broken, price action and volume is king as they reflect the market’s intentions. The close above the first layer of resistance at 1.1443 is a major warning sign that yet another attack towards 1.15 is on the cards. Notice, the retest of 1.15 would be just 4 days after it was last tested, which suggests sellers’ conviction is definitely waning. The pick up in the risk environment underpins the USD liquidation short-term, as does the latest fundamental developments by the Fed (blinking), which was well telegraphed by the widening of the German vs U.S. bond yield spread. However, the economic data in the EZ is far from giving us much enthusiasm as the repercussion for a dovish tilt in the ECB monetary stance cannot be underestimated. The bond yield curve in Germany should be a red flag. Overall, it looks like an opportunity to be a buyer on weakness remains the scenario most attractive, especially if one considers that the downside is now supported by the back side of the 1.1443 + range POC at 1.14.
GBP/USD — Enters Resistance Amid Broad-Based USD Weakness

Fundamentally, if you can’t foresee the Brexit situation getting better before it gets worse, the Sterling is currently exchanging hands at an area of high interest. The area it trades at, circa 1.28, constitutes the POC through October and what I expect to be a major wall of offers. The area highlighted in red should be very solid in terms of liquidity for a potential sell-side campaign ahead of next week’s second Brexit meaningful vote. Also, bear in mind that the Put premiums remain elevated vs Calls, so there is still a genuine perception that the Sterling is trading at too rich levels based on the risks ahead. One of the possible scenarios to play out, as recently reported, is that the EU and the UK find a way to extend the article 50 in order to keep kicking the can down the road and going back to the drawing table for the necessary concessions. The pair is still subject to major erratic vol.
EUR/CAD — Heading Into Buy-Side Territory

A chart that caught my attention this morning is the CAD against the EUR. It’s fast approaching the origin of a major demand area where we saw an impulsive move up. What’s most compelling is that we could be buying euros at a rate that makes the deal really attractive from a valuation perspective, as the German vs Canadian bond yield spread exhibits a major divergence with price. If we look back the last quarter, the price has been moving in lockstep with the spread, hence making a buy-side campaign off 1.52–5220 an idea worth considering. The meteoric rise in the Loonie in the early days of ’19, also appears to be out of whack with the more moderate recovery observed in the price of Oil, now heading back to retest $50.
NZD/USD — Revisits The 50% Retracement After Structure Break

The Kiwi found a bottom at the 100% projected target anticipated at 6580–85. Since the retest of the low came amid a major divergence in the bond yield spread, it’s no coincidence that the market found genuine value to engage in a buy-side campaign. The price appears to have rebounded too fast, too quick towards a major area of interest now, depicted by the 3rd touch of a descending trendline, which coincides with the 50% fib retracement of the latest move down. The symmetries in this market as of late have been playing out with great accuracy, so I’d expect significant sell-side interest. Note, the yield spread still shows a macro advantage for the Kiwi, so one must be mindful that pockets of downside liquidity to bid the Kiwi at nearby levels could lead to significant challenges to push further up. What matters here and the main point to take home is that the pair is at a crossroads, technically speaking. Besides, the premium paid to buy AUD Puts remains very quite high, so by
Options — 25 Delta RR & Vols
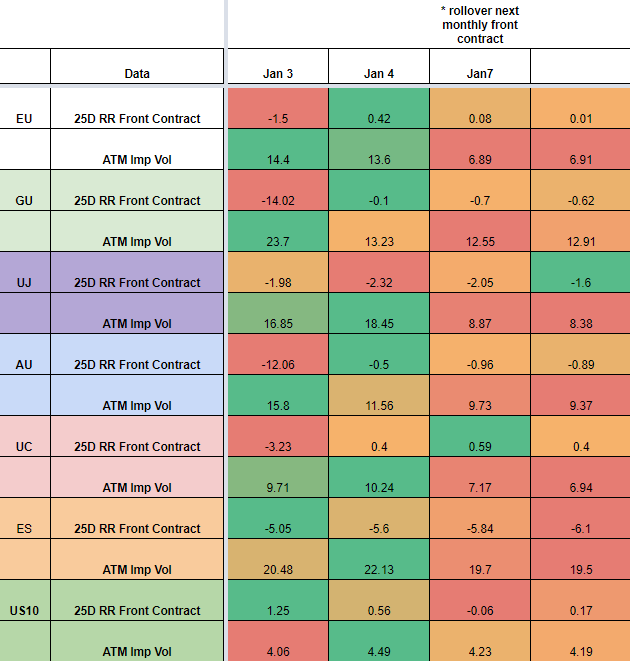
* The 25-delta risk reversal is the result of calculating the vol of the 25 delta call and discount the vol of the 25 delta put. … A positive risk reversal (calls vol greater than puts) implies a ‘positively’ skewed distribution, in other words, an underperformance of longs via spot. The analysis of the 25-delta risk reversals, when combined with different time measures of implied volatility, allows us to factor in more clues about a potential direction. If the day to day pricing of calls — puts increases while there is an anticipation of greater vol, it tends to be a bullish signal to expect higher spot prices.
Source: http://cmegroup.quikstrike.net (The RR settles are ready ~1am UK).
Options — Ratio Imp/Hist Vol & Insurance Protection
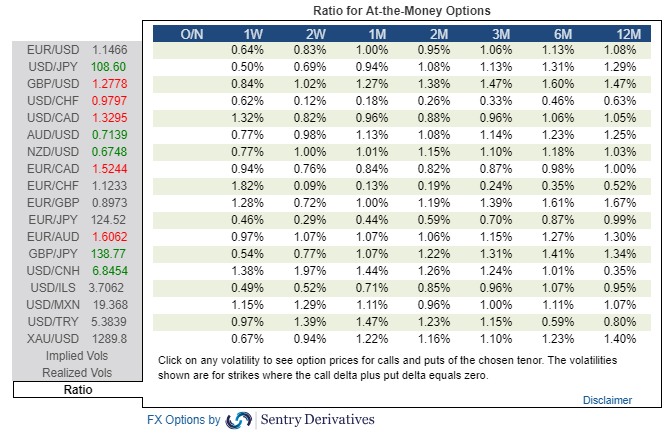
* If implied vol is below historical vol, represented by a ratio 1%, we are faced with a market that carries more unlimited risks given the increased activity to sell expensive volatility (puts), hence why it tends to result in a more directional market profile when breaks occur. The sellers of puts must hedge their risk by selling on bearish breakouts and vice versa.