

The Daily Edge is authored by Ivan Delgado, Head of Market Research at Global Prime. The purpose of this content is to provide an assessment of the market conditions. The report takes an in-depth look of market dynamics, factoring in fundamentals, technicals, inter-market, futures and options, in order to determine daily biases and assist one’s decisions on a regular basis. Feel free to follow Ivan on Twitter & Youtube.
Summary
If the volatility, or best put to make justice to the moves, the flash crash witnessed in the Yen crosses during the twilight NY-Tokyo transition is any guidance for what’s to come in 2019, buckle up traders, it’s going to be a wild ride.
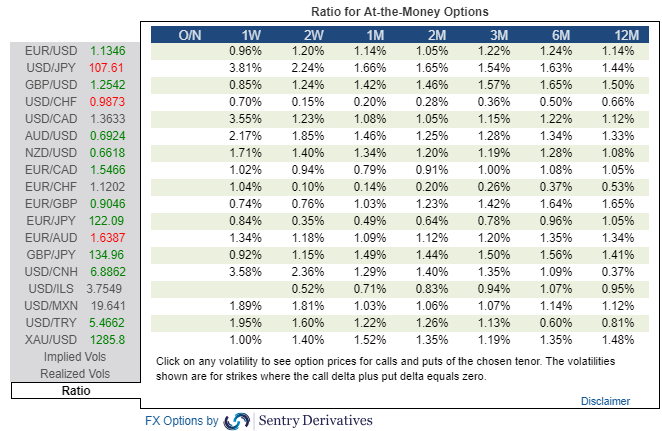
If it wasn’t enough with a VIX above 25.00 to start the year, how about a test of 105.00 in USD/JPY as potential pre-cursor for volatility returning with a vengeance in forex this year? With an increasing number of Forex pairs exhibiting implied vols breaking above its historical standards, the prospects of the market profile getting much more directional this year remain firm.
Find out more about the relationship between impl vs hist vols here
Be warned, the overblown move in the Yen crosses has not translated in a move of the same proportion in other risk-sensitive assets out there. Yes, it’s still very precarious given the shoot up in the darling of risk-off currencies or the massacre of Aussie longs, but if we take a look at the internals of our risk model (more below), neither US equity futures (ES), US fixed income or the price of Gold suggest panic selling, hence it makes it clear that the move in the Yen should be treated in isolation vs risk deterioration across the board.
A few culprits behind this disorderly snowball effect include the low liquidity period (exacerbated by holidays in Japan), macro stops taken out in Yen crosses, algo smelling panic, all within a context in which Apple (NASDAQ:AAPL) warned about the sharp economic contractions in China, which was rationalized as the main reason they missed so badly on earnings and cut their Q1 revenue guidance.
The insights into the Chinese economy by a key player like Apple should not be underestimated and understandably, it promoted a sense of panic. Apple’s warning gives us an opportunity to evaluate the state of affairs in China as a true measure of economic activity without the intervention of stated-owned actors to massage the data. Apple was especially vocal on the slowdown in China since H2 2018 as the contentious trade tensions raged on.
The pendulum of risk used to swing left and right depending on the progress in the Sino-US trade war status back in 2018. However, the trade truce from early December and the price action that has followed ever since is sufficient evidence that we’ve transitioned into a whole new thematic…
One in which the market psyche is looking past the isolated tit for tat US-China trade dispute, to instead shift its focus towards a global slowdown in growth. China will continue to be a decent barometer, as the slower its growth gets, the more the rest of the world will pay the consequences given the amount of influence in global economic activity China represents.
The latest miss in the Caixin Dec Manufacturing PMI at 49.7 (first contraction since May 2017) coupled with Apple’s shocker has only worsened the pessimism around growth. It seems inevitable that the Chinese Central Bank will have to resort to a more proactive approach in order to contain the weakening of the economy by promoting expansionary fiscal policy and a moderated approach to easier monetary policies, with a sacrifice to the deleveraging process.
The one-way-street moves in risk-off from recent weeks continue to leave us breadcrumbs of information = 2019 is off with a market that is exceptionally worried about the sneezes of China, and the cold being caught globally.
There were signs written all over the wall in late 2018 of an ailing state in the global economy. From the magnitude of declines in Oil prices, the synchronized sell-off in global equities, the acceleration in the flattening of the US bond yield curve only to mention a few, which left us with a picture that speaks by itself. It’s been the most negative YoY performance across all asset classes, in USD terms, in many decades.
Another major driver this year, other than global growth, is set to be the potential shift in attitude by the Fed, rapidly moving into a cul-de-sac road with no easy way out. In other words, the massive tightening of financial conditions is doing all the heavy lifting for them. The Eurodollar futures, the Fed funds CME contract or the US yield curve all signal trouble is brewing ahead for the US economy, with the levels dealt clearly telegraphing that the market is not buying into the US growth story in 2019.
Later today, we will have yet another opportunity to analyze the anatomy of the US economy via the release of the US ISM Manufacturing PMI, a series that after peaking out at 61.00 late last year, it’s been unable to keep up the pace growth despite the latest number still showed a hefty 59.3.
Risk Model: Ugly Picture But Not Justifying Yen Move
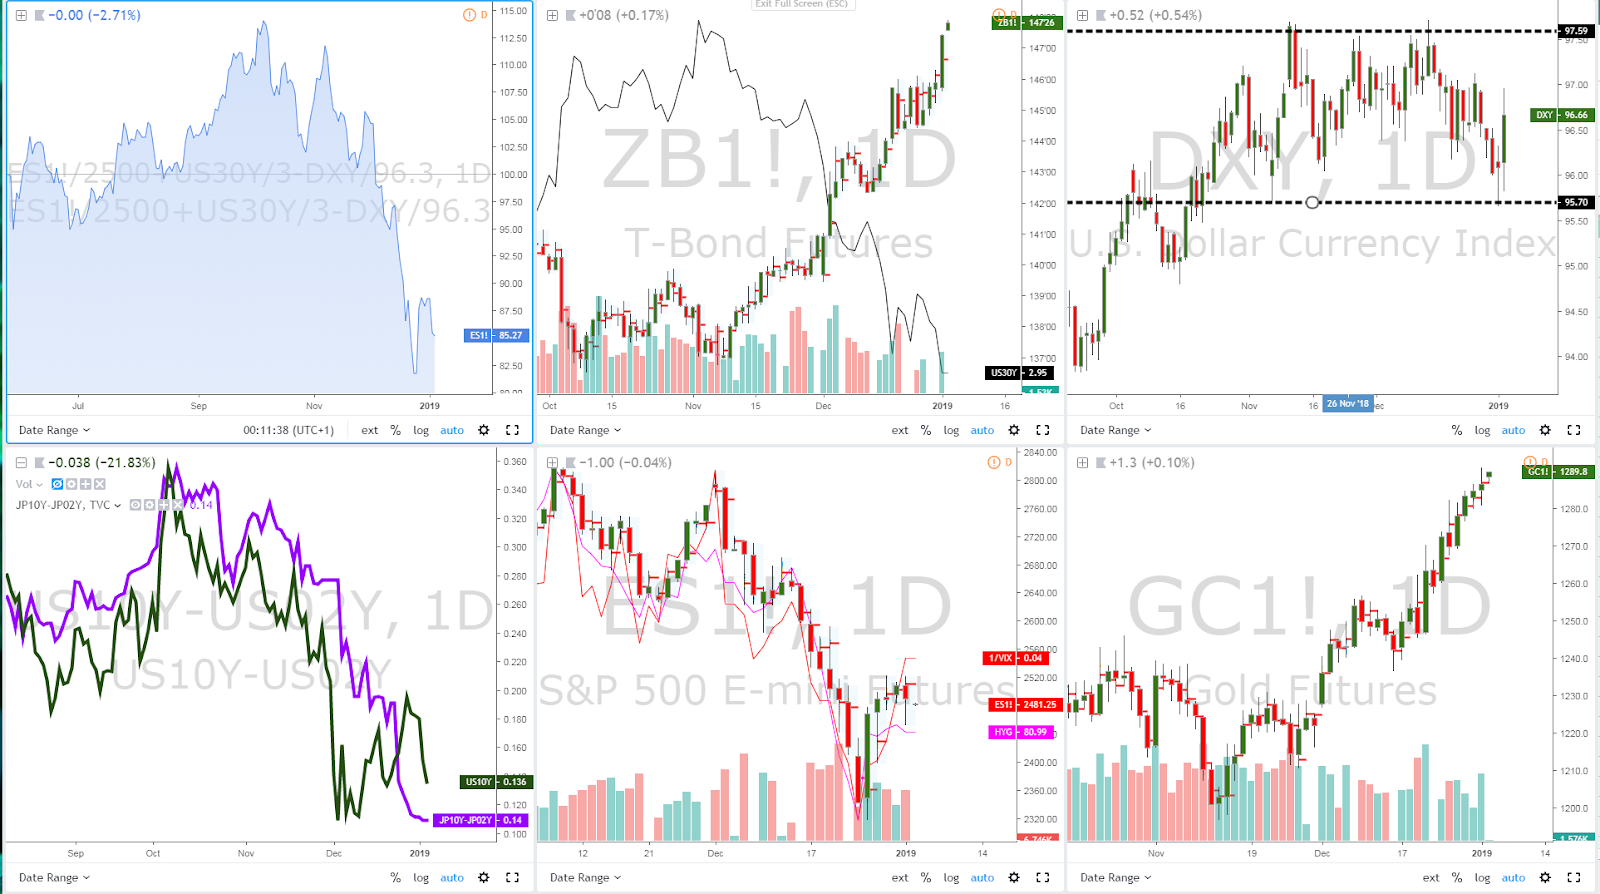
By scoping out the internals of risk assets, I must say, the abnormal volatility we are seeing in the Yen or the Aussie seems to be out of whack considering the moderate vol observed in the ES futures. This should definitely guarantee that the post capitulation movement in Yen crosses can potentially signify a meaningful bottom as the one seen years ago when the Pound collapsed.
Equities have a long way down to go, as do global yields, to really justify a yen exchanging hands near 70.00 against the Aussie or around 105.00 against the US Dollar. It was only a few weeks ago that I found myself reporting on how macro expensive USD/JPY traded at around 113.00. How things can change in just a matter of weeks still puzzles me!
I must now start promoting, even if for only the next few weeks, the view that this volatility should bring about some near-term opportunities to be a Yen seller, especially if the Bank of Japan starts making some noise about an interventionist narrative. Let’s not forget, it’s public holidays all week-long in Japan, which may see the risk of a delayed response?
In the grand scheme of things, few will argue the market most sensitive to risk (stocks, US bonds, gold) are all screaming to keep reinstating positions in line with the established trends. Even the yield curves in the US or Japan keep bleeding lower, which if anything, asserts the sense of worry and uncertainty.
In this current treacherous environment, it’s important to be on the defensive. While the short-term movements, especially on the Aussie or the Yen appear to be way overblown, in the macro picture, as depicted by the chart above, we’ve confirmed some major technicals breakouts.
Just take a look at the ZB contract for instance (US 30y bond), breaking through the 146.00 area, or the determined bearish resolution outside of its nov-dec range in the S&P 500, not to mention the constant appreciation in the price of gold. The latter has clearly detached as a function of USD performance to instead reflect a constant bid more in tune with a market that is going through a major rethink over the ability of central banks to really justify further restrictive policies amid a clear global growth slowdown.
Chart Insights- What Are You Missing?
EUR/USD: Compelling Case To Buy Weakness Remains
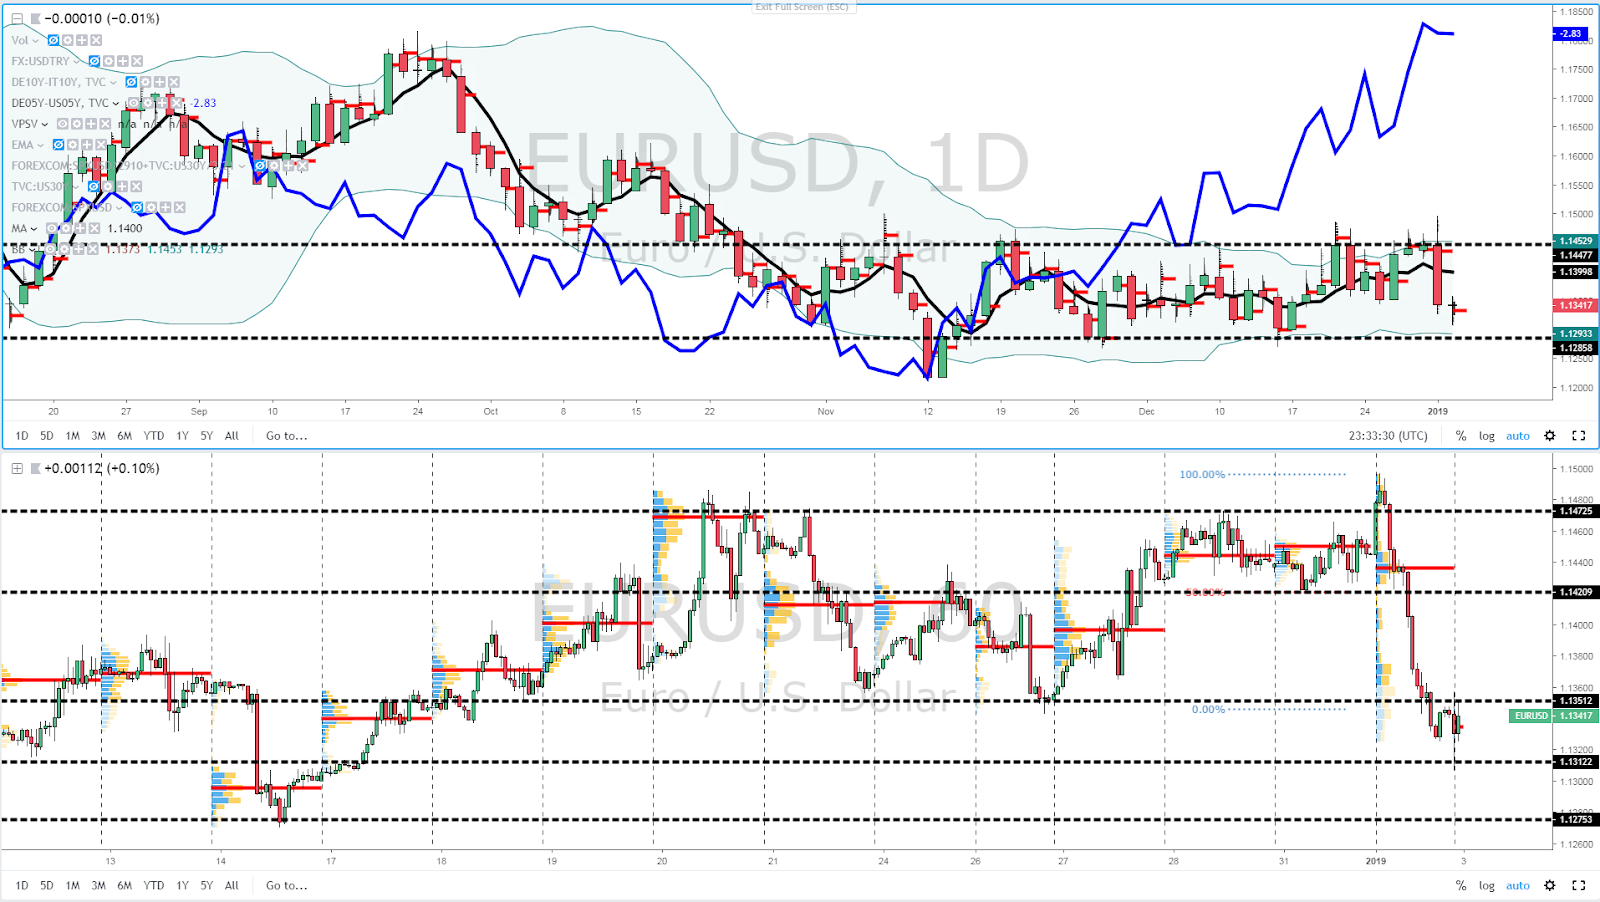
Wednesday’s bearish outside day is a clear reminder that despite the major deviation between the pricing of the pair and its yield spread (German vs US), there are other forces, namely the ailing economic trend in Europe, that is preventing the Euro to garner the necessary momentum.
While at first sight, the size of Wednesday’s bar may suggest the outlook has turned negative, there is very limited leeway to the downside before the price the Euro will be dealt with start being interpreted as once again, an opportunity to buy on weakness, as was the case through the 3rd week of Dec.
Every time you are faced with doubts about the merit of buying Euros, you must always ask yourself. Is it justified based on the yield spread? That box seems to be ticked for the foreseeable future. Secondly, is the pair trading at an area of high interest? It will be soon as 1.13 and below get retested.
On the hourly, we can clearly see the pair has broken its 100% projection target, so one should expect the area around 1.1350 to be the immediate resistance for momentum accounts, with 1.1310 ahead of 1.13 the next nearby supports, followed by 1.1275. As the hourly structure stands, correction should be seen as selling opportunities intraday. The trap of 3 days worth of volume above the 1.1420 is a clear testament that in the very short term, the pain is most felt to the downside, even if, and I will reiterate it, the downside potential for an extension past 1.13 should be limited.
GBP/USD: A Function Of USD Performance For Now
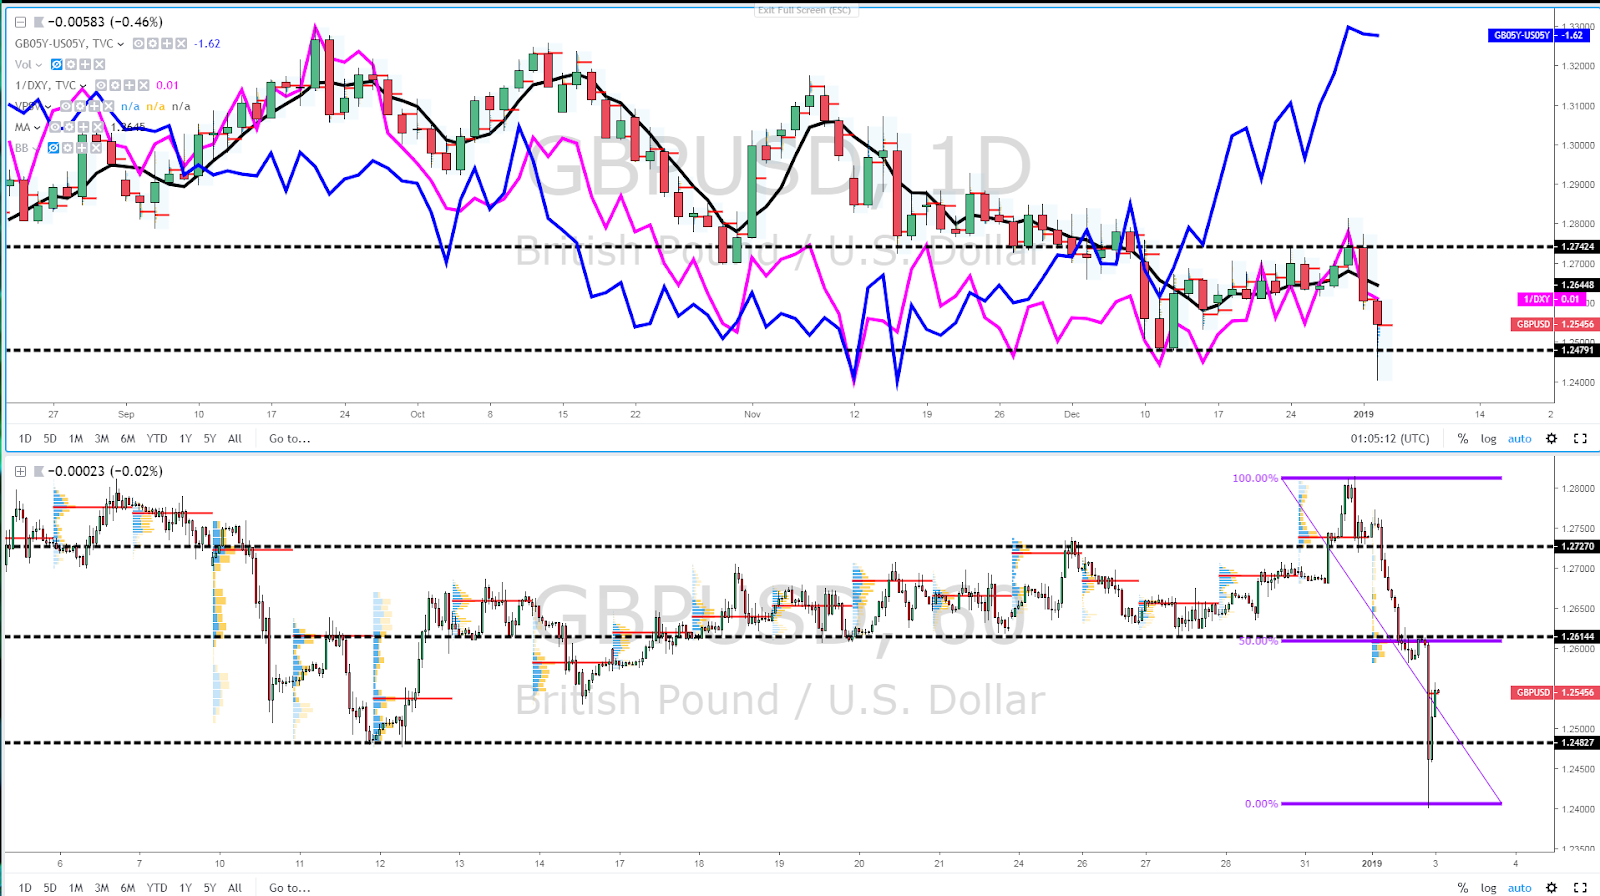
With the UK parliament set to reconvene on Jan 9 to resume the Brexit deal negotiations, we find a Pound exchanging hands at awfully cheap levels if one only pays attention to the UK vs US yield spread. However, unlike the Euro, the Sterling has some serious political risks to contend with before the next move in the Brexit saga, which is obviously keeping the downside pressure intact in line with the bearish structure on the weekly and daily timeframes.
As shown above via the magenta line (1/DXY), the Sterling has been trading tightly correlated to the performance of the US Dollar, therefore, with a EUR/USD soon to be at a discount (sub 1.13), alongside the UK vs US yield spread on a tear, liquidity pockets nearly 1.25 should be an attractive area to engage in near-term buys. This should prevent the currency from breaking much lower unless the move originates from a GBP-centric weakness (demerits) due to negative Brexit headlines.
Notice the relevance on the measured move principles taught previously and how in today’s price crash during the Asian session market-makers bids around the 1.24 have proven to be the very bottom of the move, further solidifying the view that the market should still remain underpinned by bargain hunters. Meanwhile, structurally wise, this is a market that appears set to stay offered on rallies too, with any pullback set to face a major roadblock at 1.1210–15, Wed’s POC.
USD/JPY — Too Sharp, Too Fast
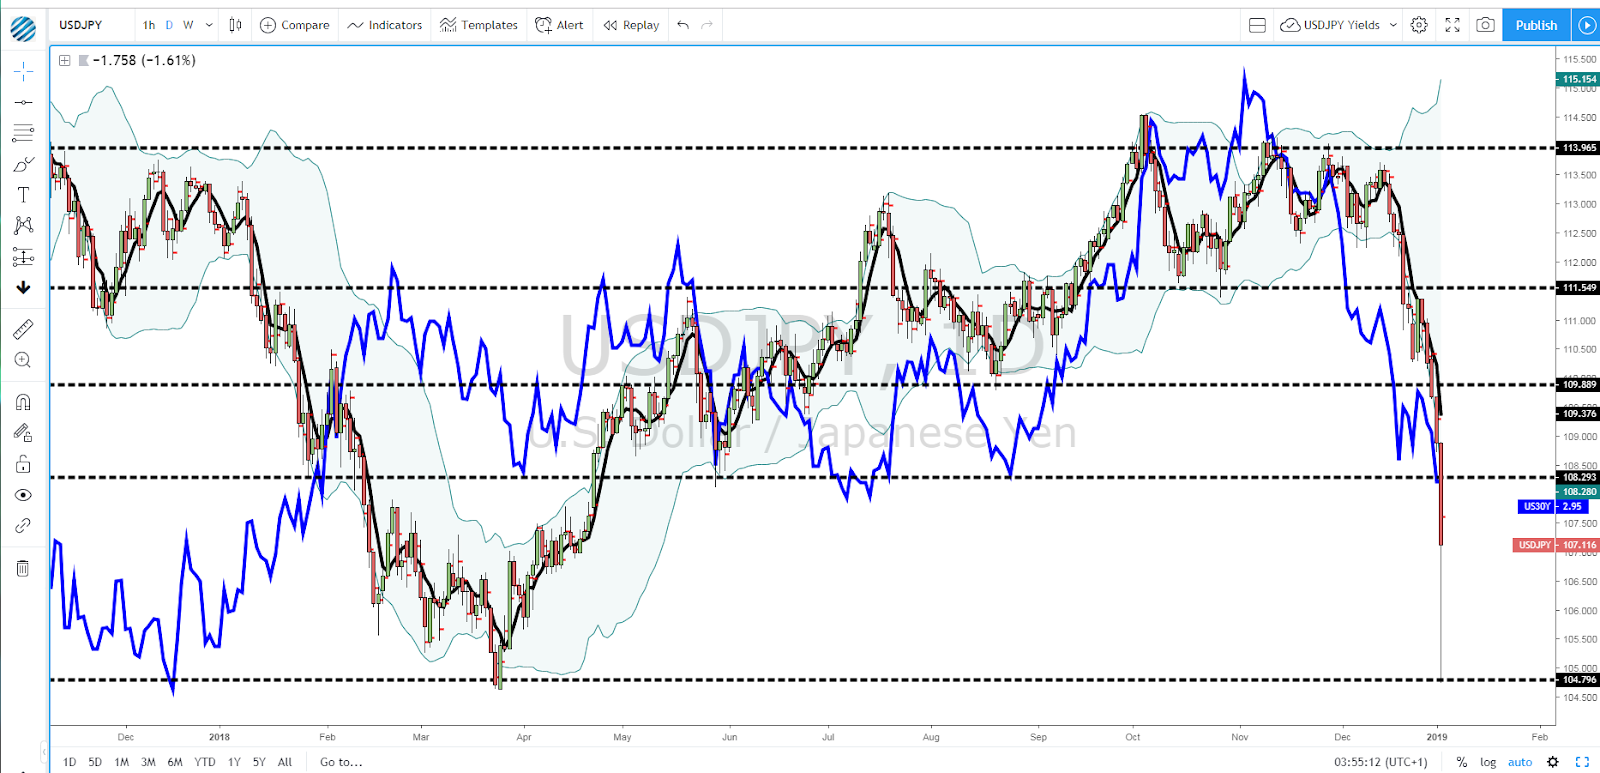
Few will argue that the pair, by any measure, looks extremely overstretched after the algo-feast that took place in the twilight Asian period. If we were to cross-reference the US 30y bond yield (blue line) or the US vs JP yield spread for this matter (both highly correlated), the levels the pair trade at the start to look cheap from a macro perspective. If we have a look at the last time the US 30y yield traded this low, any deals sub 110.00 should offer short-term value to engage in buys or else being equal.
Correlated risk assets such as the ES mini or Gold as the preferred vehicle to seek shelter when the proverbial hits the fan are relatively stable. Moreover, if we take a look at the latest macro sell-offs in the USD/JPY in recent years, none has really stretched this far (+900p) without a considerable correction. In December of 2017, a very similar sell-side pattern developed, bottoming out at 105.00, precisely the price it has rejected from in today’s massacre.
AUD/USD — Bearish Resolution Sub 70c Keeps Bears In Charge
Aside from the logical talk of the flash crash in the Yen crosses, a key takeaway from today’s rapid sell-off in the Japanese currency is the massive technical breakout in the AUD/USD. While the precursor to experiencing further pain ahead was already in place after Wednesday’s close sub 0.70, the outlook has worsened considerably after a run that’s taken the Aussie down more than 200 pips or over 3x its daily range.
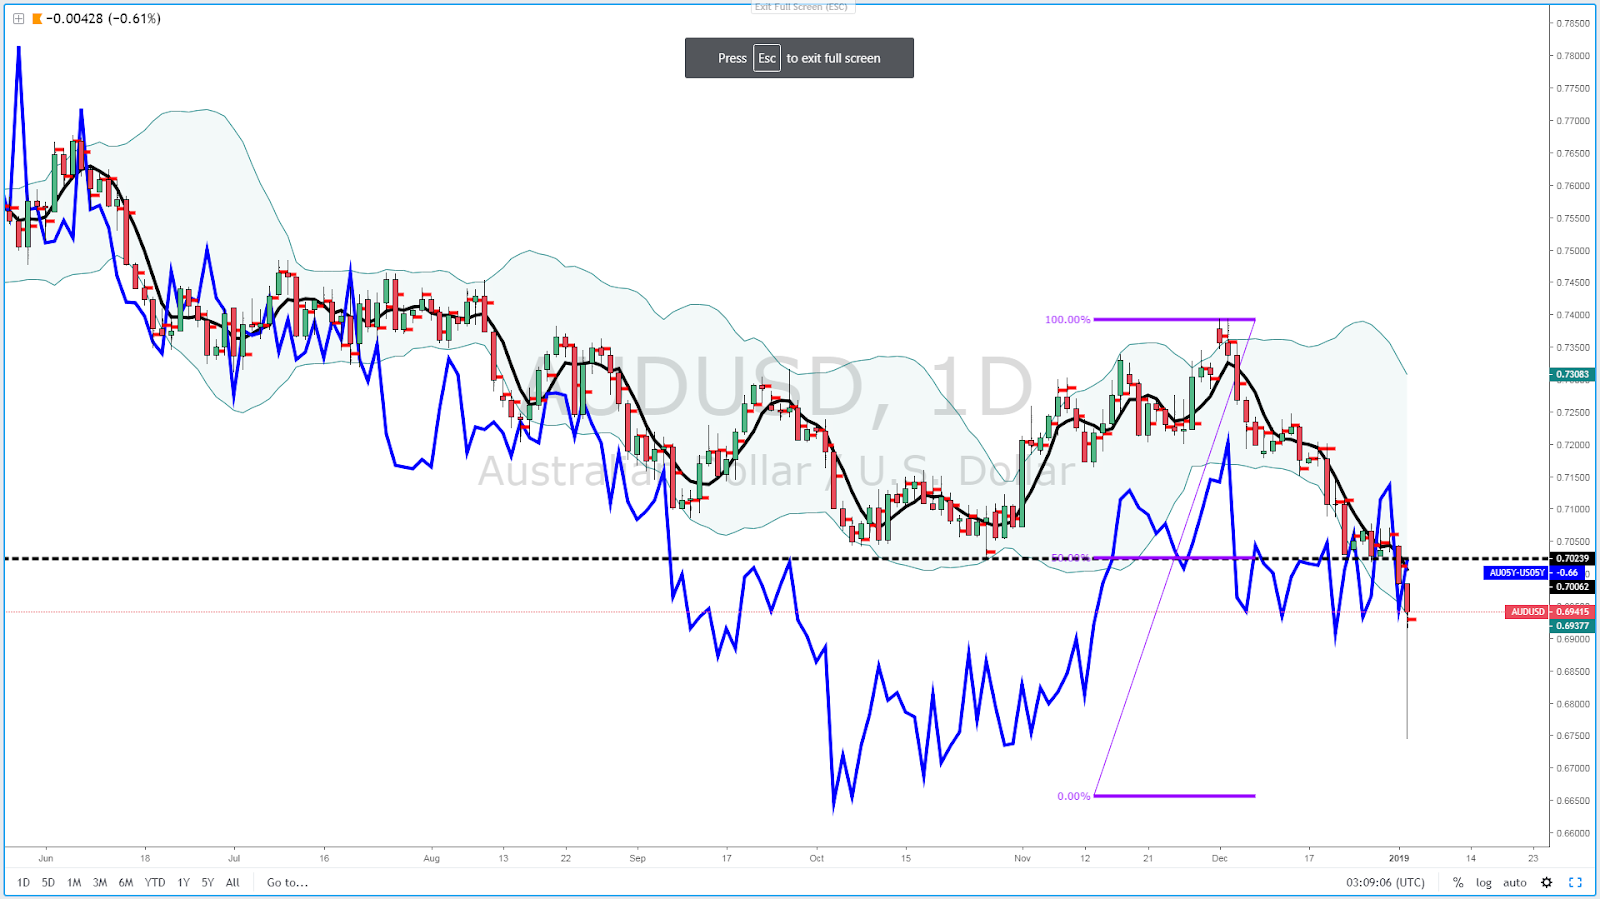
Analogous to what’s been observed in other markets, the Aussie vs US 5-year bond yield spread does not justify these levels. However, that’s just one force at play here, and with risk so suppressed, the pressure lower in the Aussie emanates by and large via the depressed risk profile seen. Any retest towards 0.70–7050 should find layers upon layers of clustered offers to keep the downside pressure going. The projected target of the current bearish cycle should be found around the 6670 area, as the chart illustrates.
Important Footnotes
- Risk model: The fact that financial markets have become so intertwined and dynamic makes it essential to stay constantly in tune with market conditions and adapt to new environments. This prop model will assist you to gauge the context that you are trading so that you can significantly reduce the downside risks. To understand the principles applied in the assessment of this model, refer to the tutorial How to Unpack Risk Sentiment Profiles
- Cycles: Markets evolve in cycles followed by a period of distribution and/or accumulation. The weekly cycles are highlighted in red, blue refers to the daily, while the black lines represent the hourly cycles. To understand the principles applied in the assessment of cycles, refer to the tutorial How To Read Market Structures In Forex
- POC: It refers to the point of control. It represents the areas of most interest by trading volume and should act as walls of bids/offers that may result in price reversals. The volume profile analysis tracks trading activity over a specified time period at specified price levels. The study reveals the constant evolution of the market auction process. If you wish to find out more about the importance of the POC, refer to the tutorial How to Read Volume Profile Structures
- Tick Volume: Price updates activity provides great insights into the actual buy or sell-side commitment to be engaged into a specific directional movement. Studies validate that price updates (tick volume) are highly correlated to actual traded volume, with the correlation being very high, when looking at hourly data. If you wish to find out more about the importance tick volume, refer to the tutorial on Why Is Tick Volume Important To Monitor?
- Horizontal Support/Resistance: Unlike levels of dynamic support or resistance or more subjective measurements such as fibonacci retracements, pivot points, trendlines, or other forms of reactive areas, the horizontal lines of support and resistance are universal concepts used by the majority of market participants. It, therefore, makes the areas the most widely followed and relevant to monitor.
- Trendlines: Besides the horizontal lines, trendlines are helpful as a visual representation of the trend. The trendlines are drawn respecting a series of rules that determine the validation of a new cycle being created. Therefore, these trendline drawn in the chart hinge to a certain interpretation of market structures.
- Correlations: Each forex pair has a series of highly correlated assets to assess valuations. This type of study is called inter-market analysis and it involves scoping out anomalies in the ever-evolving global interconnectivity between equities, bonds, currencies, and commodities. If you would like to understand more about this concept, refer to the tutorial How Divergence In Correlated Assets Can Help You Add An Edge.
- Fundamentals: It’s important to highlight that the daily market outlook provided in this report is subject to the impact of the fundamental news. Any unexpected news may cause the price to behave erratically in the short term.
- Projection Targets: The usefulness of the 100% projection resides in the symmetry and harmonic relationships of market cycles. By drawing a 100% projection, you can anticipate the area in the chart where some type of pause and potential reversals in price is likely to occur, due to 1. The side in control of the cycle takes profits 2. Counter-trend positions are added by contrarian players 3. These are price points where limit orders are set by market-makers. You can find out more by reading the tutorial on The Magical 100% Fibonacci Projection