
The State of Affairs in Financial Markets — Jan 18
US stocks enjoyed a late-day boost driven by renewed hopes that the US is mulling the possibility of reaching a more protracted compromise with China on trade and further underpin the risk sentiment. The reports still remain a tad unsubstantiated by the absence of key policymakers. What we’ve seen so far is the market buying up in the rumors after a report via the WSJ/DJ.
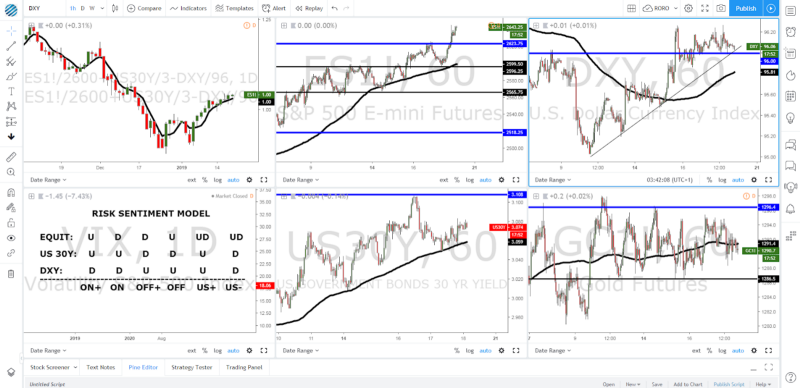
If we take a look at the risk-weighted index, it’s printed a decisive bullish outside day with the 5-day MA still pointing to further gains ahead The broader spectrum of risk-sensitive assets monitored do offer an analogous sanguine outlook as a result. The ES has rocketed into the cycle highs, breaking and most importantly, closing above the major area of daily resistance at 2,623.00. Industrial goods and conglomerates were the industries leading the charge higher on Thursday.
Even the US fixed income market, which had shown some tentative signs of slowing down, has also found enough buying interest to keep the bullish tone in risk widespread. Meanwhile, the bullish outlook on the DXY is less clear as the index, as shown in the chart above, has entered range bound conditions in the last couple of days. In favor of the US Dollar is the support found at the 96.00, an area of critical resistance that has now turned support. The 5-day MA still suggests the general tendency is for the US Dollar to find further support, although in such a pick up in risk, gains should remain capped by the outperformance, especially from commodity-linked currencies.
Chart Insights — Trading Opportunities
EUR/USD — Finds Cluster Of Bids At Key PoC Area
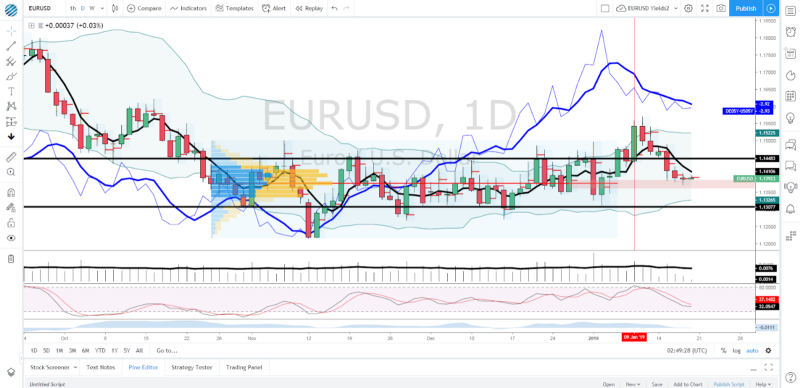
The Euro continues to absorb offers along the PoC of its long-held range. Since the impulsive sell-off on Jan 15, the following days have been characterized by what may be set up to constitute a transfer of ownership from weak-handed sellers into value buyers. The divergence between the German vs US yield spread and the pricing of the pair continues to suggest we are in an area that is not technically relevant (POC, bullish structure), but it should also be perceived as discounted.
USD/JPY — Value Higher As Sell-Side Trapped
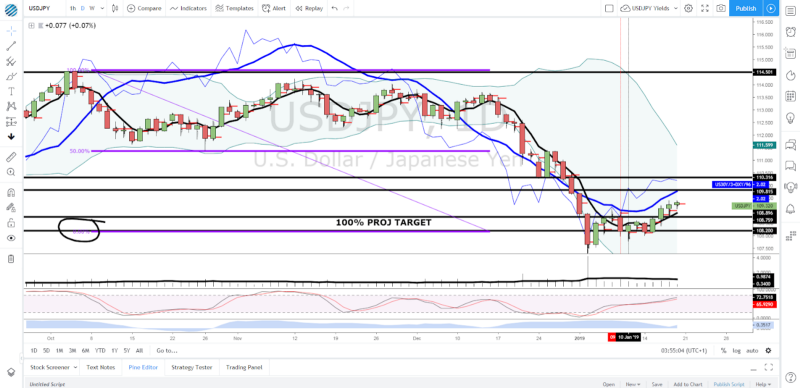
The Japanese Yen trades on the back foot amid the reinvigoration of the risk trade. The bullish reversal bar with Thursday PoC left behind the bullish close is a positive development. The upward slope in both the 5-day MA as well as the rise in the DXY + US yields is yet further factors that are supporting, for the time being, the bullish dynamics in a market that appears now destined towards more ambitious targets towards the 109.80–110.00 macro resistance.
AUD/USD— Bulls Re-Take Short-Term Control
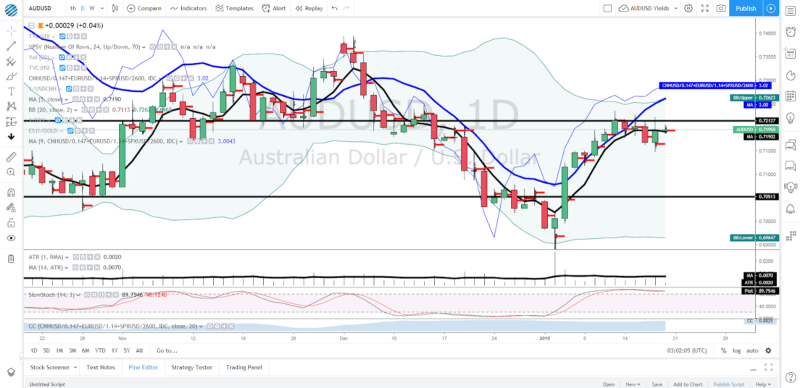
Boosted by the positive headlines around the expectations for a lift in tariffs by the US to China, the Australian Dollar has managed to regain the upside and trap sellers wrong-footed, as depicted by the where most of the volume transacted in the last 24h stands (0.7165) vs bullish close of 0.7195. The value in the Aussie market keeps pointing towards higher levels if we pay attention to the strongest correlations for the Aussie, which include the Chinese Yuan, DXY and equity performance (ES). That said, 0.7215/20 has been a major sticky obstacle to surpass through the week, hence a close above is still necessary to brighten the outlook for the Aussie, which remains supported by China’s trade hopes as the main driver, even as the domestic economy shows further cracks in its housing market.
Important Footnotes
- Risk model: The fact that financial markets have become so intertwined and dynamic makes it essential to stay constantly in tune with market conditions and adapt to new environments. This prop model will assist you to gauge the context that you are trading so that you can significantly reduce the downside risks.
- Cycles: Markets evolve in cycles followed by a period of distribution and/or accumulation. The weekly cycles are highlighted in red, blue refers to the daily, while the black lines represent the hourly cycles.
- POC: It refers to the point of control. It represents the areas of most interest by trading volume and should act as walls of bids/offers that may result in price reversals. The volume profile analysis tracks trading activity over a specified time period at specified price levels. The study reveals the constant evolution of the market auction process.
- Tick Volume: Price updates activity provides great insights into the actual buy or sell-side commitment to be engaged into a specific directional movement. Studies validate that price updates (tick volume) are highly correlated to actual traded volume, with the correlation being very high, when looking at hourly data.
- Horizontal Support/Resistance: Unlike levels of dynamic support or resistance or more subjective measurements such as fibonacci retracements, pivot points, trendlines, or other forms of reactive areas, the horizontal lines of support and resistance are universal concepts used by the majority of market participants. It, therefore, makes the areas the most widely followed and relevant to monitor.
- Trendlines: Besides the horizontal lines, trendlines are helpful as a visual representation of the trend. The trendlines are drawn respecting a series of rules that determine the validation of a new cycle being created. Therefore, these trendline drawn in the chart hinge to a certain interpretation of market structures.
- Correlations: Each forex pair has a series of highly correlated assets to assess valuations. This type of study is called inter-market analysis and it involves scoping out anomalies in the ever-evolving global interconnectivity between equities, bonds, currencies, and commodities.
- Fundamentals: It’s important to highlight that the daily market outlook provided in this report is subject to the impact of the fundamental news. Any unexpected news may cause the price to behave erratically in the short term.
- Projection Targets: The usefulness of the 100% projection resides in the symmetry and harmonic relationships of market cycles. By drawing a 100% projection, you can anticipate the area in the chart where some type of pause and potential reversals in price is likely to occur, due to 1. The side in control of the cycle takes profits 2. Counter-trend positions are added by contrarian players 3. These are price points where limit orders are set by market-makers.