Get 40% Off
⚠ Earnings Alert! Which stocks are poised to surge?
See the stocks on our ProPicks radar. These strategies gained 19.7% year-to-date.
Unlock full list

The Bull Rides Again As Global Stocks Break Out From Summer Doldrums

Published 09/04/2019, 07:44 AM
Updated 09/20/2023, 06:34 AM

US Markets

International Markets

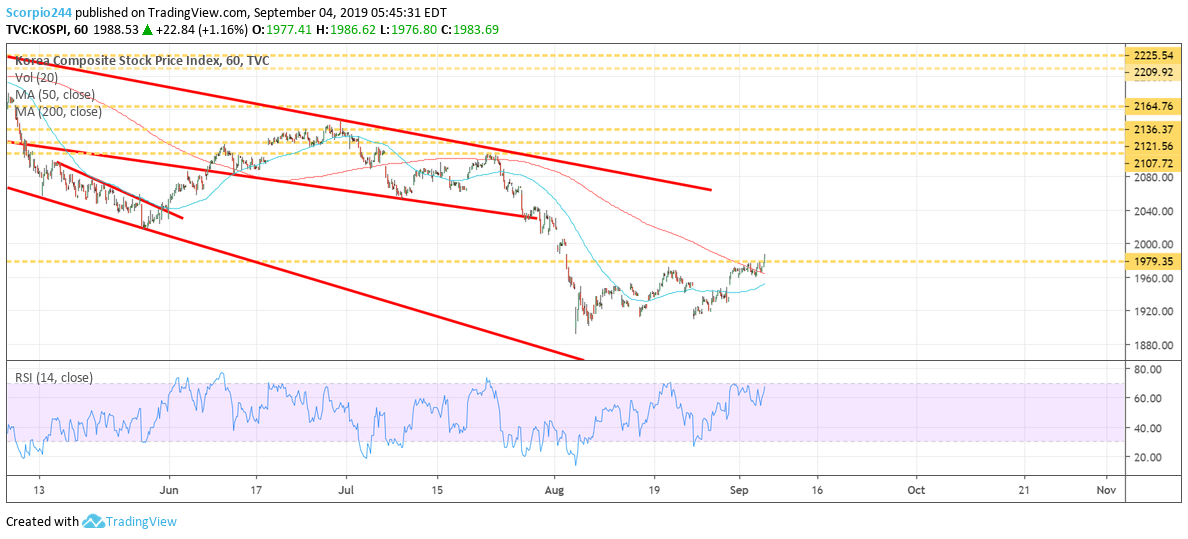
  • KOSPI +1.16%
  • Nikkei +0.12%
    • UK +0.64%

    Stocks in Asia jumped following on headlines that HK is withdrawing the extradition bill that sparked the protest in months ago.

    Hong Kong (NYSE:EWH)

    The result is that Hong Kong rose by almost 4%, and more importantly, rose above the top of the trading range the index has been in since, well, the beginning of August.
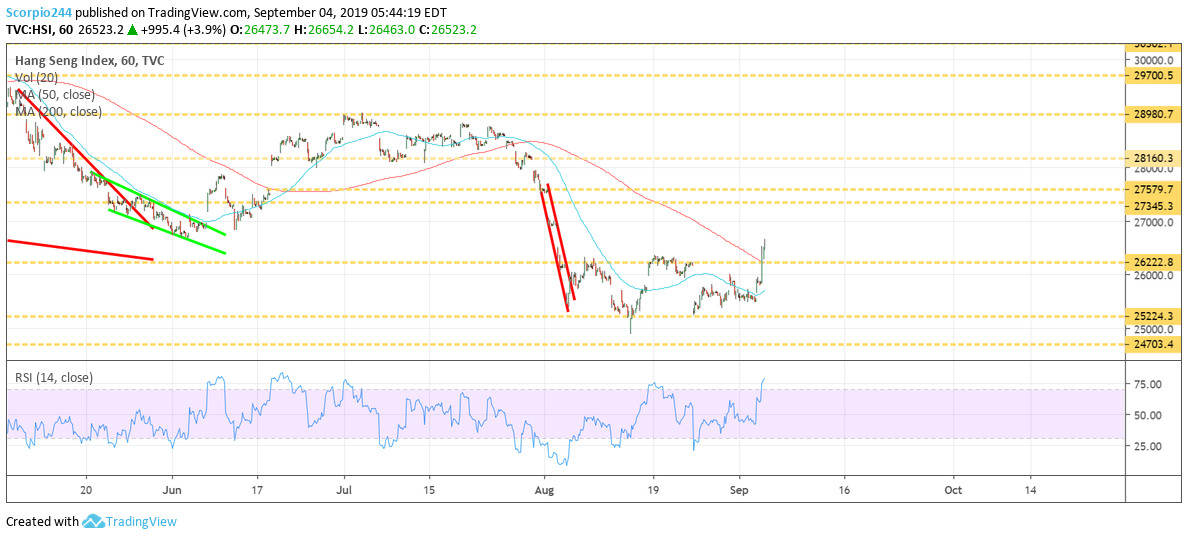
    Hang Seng Index

    Kospi (NYSE:EWY)

    KOSPI Index

    South Korea KOSPI also broke out, rising above the top of the range from August, rising above 1,980.

    Shanghai (NYSE:FXI)
    MU Inc Index

    Shanghai also broke out overnight rising above resistance at 2920, and the top of the range since August.

    UK
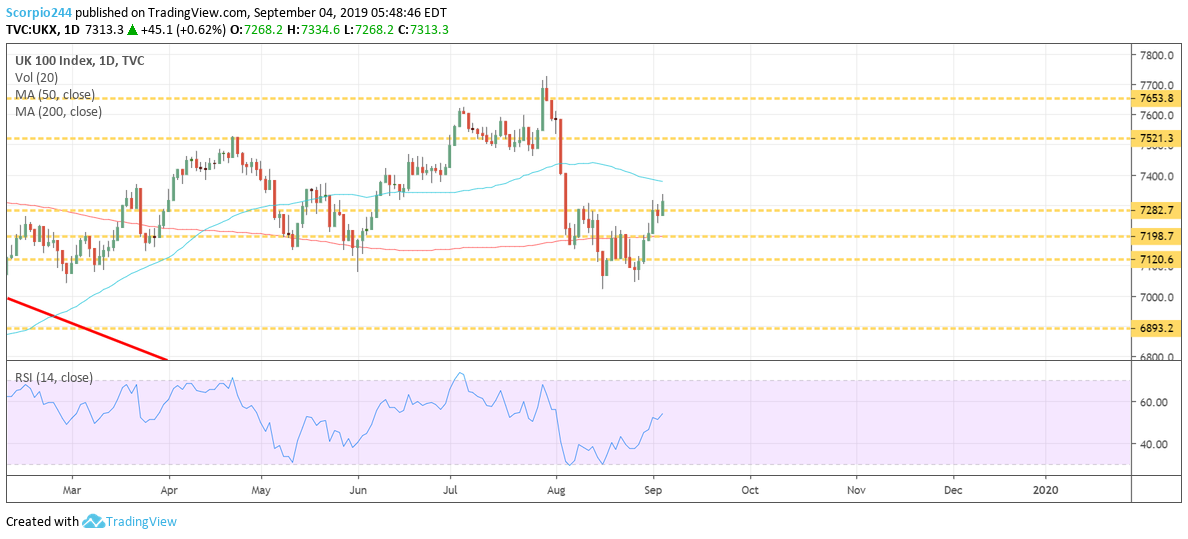
    UKX Daily Chart

    Stocks in Europe are rising too after Boris Johnson lost a critical vote in parliament. It may result in a general election while decreasing the odds of a no-deal Brexit. As a result, the UK FTSE is breaking out rising above the top of the range since, well, the beginning of August. Notice a trend here?

    Germany (NYSE:EWG)

    Germany DAX is also rising sharply, also breaking out.
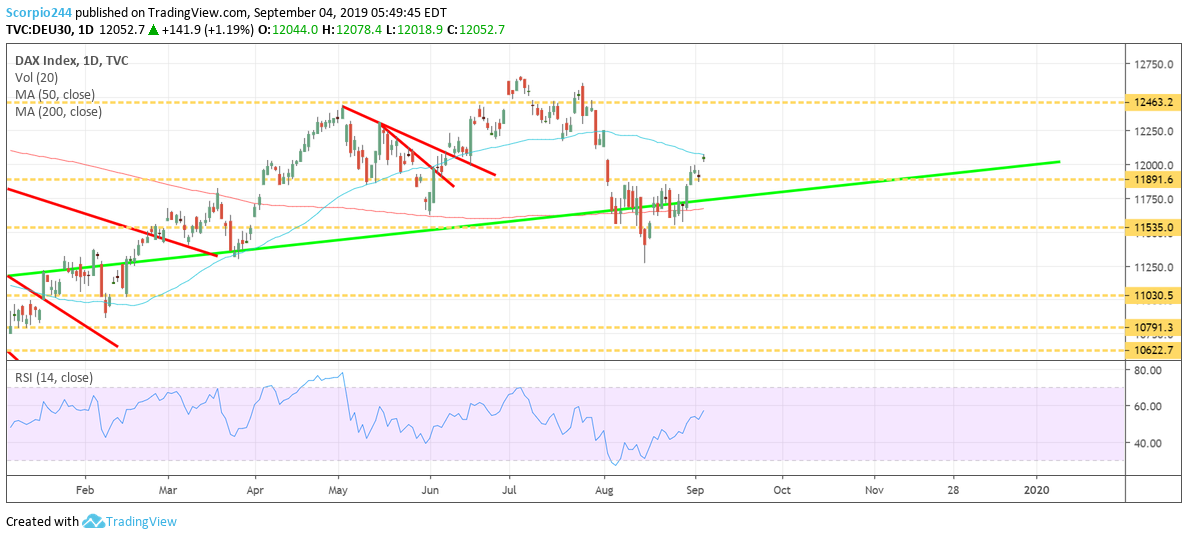
    DAX Daily Chart

    US Markets

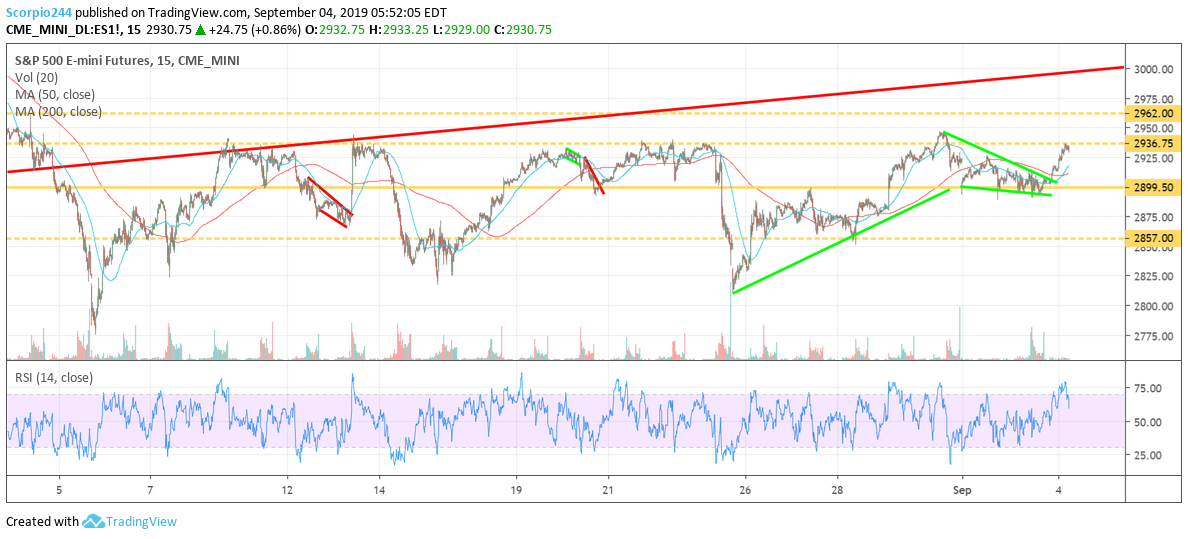
    S&P 500 (SPY (NYSE:SPY))

    S&P 500 E-mini Futures

    That leaves the US markets has the only ones that have yet to take out their August highs. Based on the patterns above, it would seem likely the break out happen here in the US happen, and probably today. The S&P 500 futures show it currently right at resistance at 2935.

    Amazon (NASDAQ:AMZN)

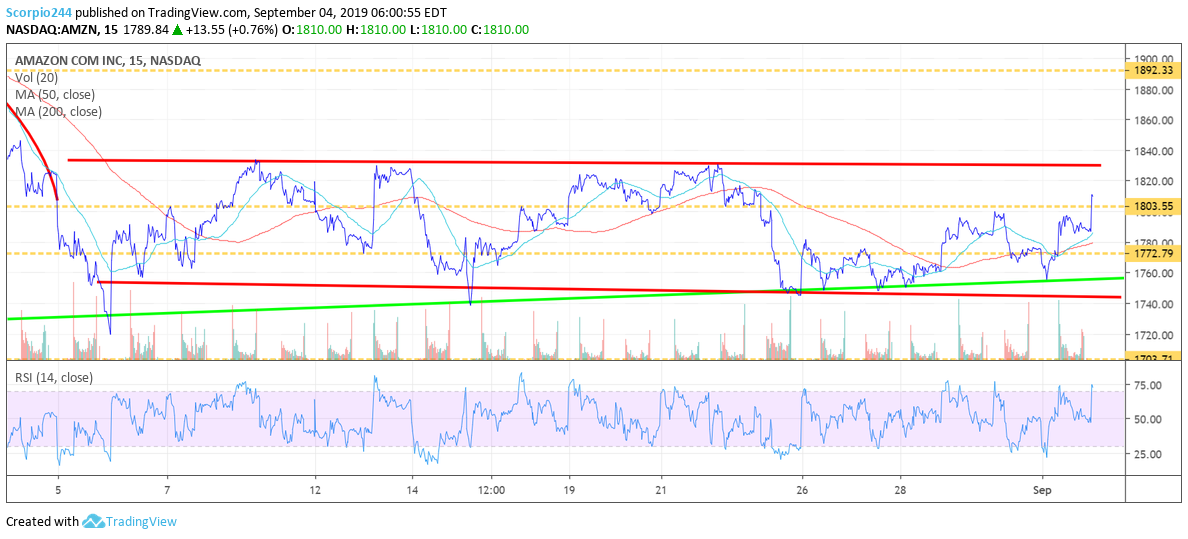
    Amazon (NASDAQ:AMZN) is one of the stock that is rising this morning, jumping above $1800, something it has struggled to do. Additionally, the next level would come at $1830, and then $1900.
    Amazon Inc Chart

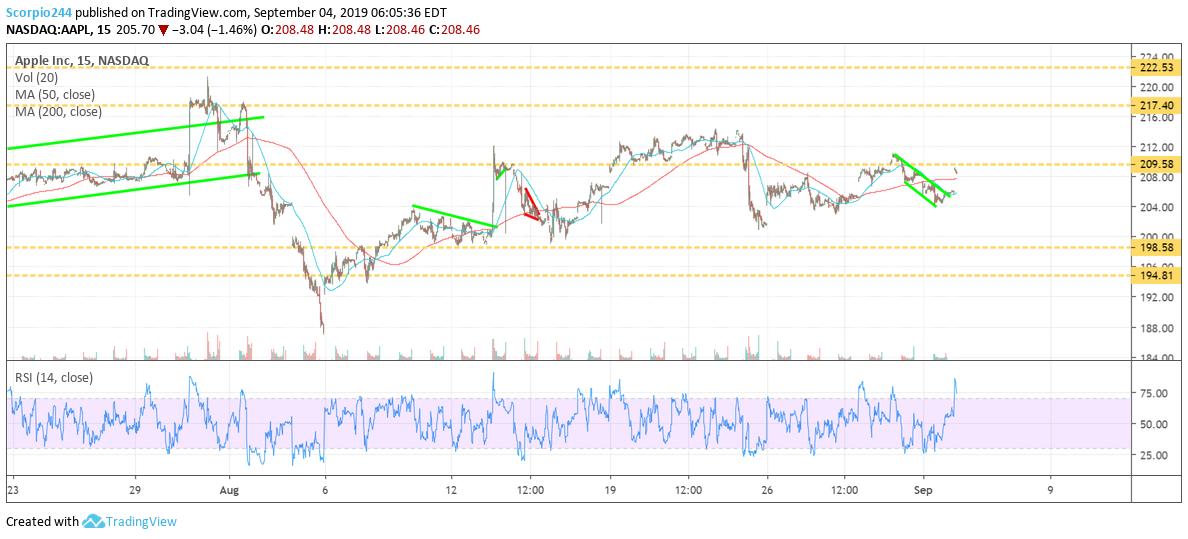
    Apple (NASDAQ:AAPL)

    Apple Inc Chart

    Apple (NASDAQ:AAPL) is also rising this morning, and rising above $209.50 opens the door to a rise of roughly $214.

    Tesla (NASDAQ:TSLA)

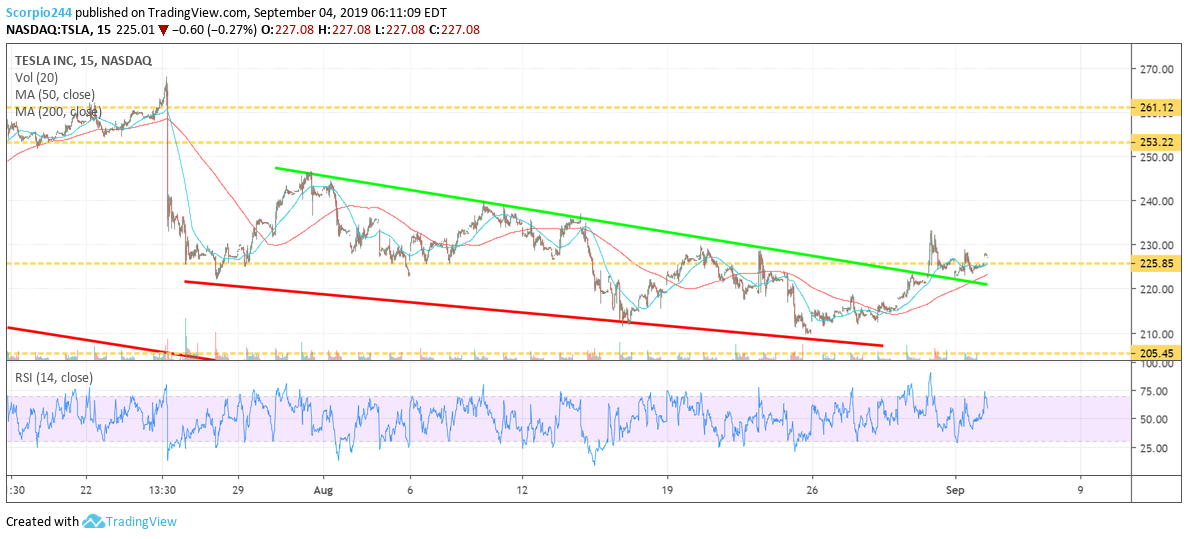
    Tesla (NASDAQ:TSLA) broke the downtrend the other day, and now shares continue to look healthy, as the story continues to evolve into a china growth story of all things. The potential is still there for an increase to $250.
    Tesla Inc Chart

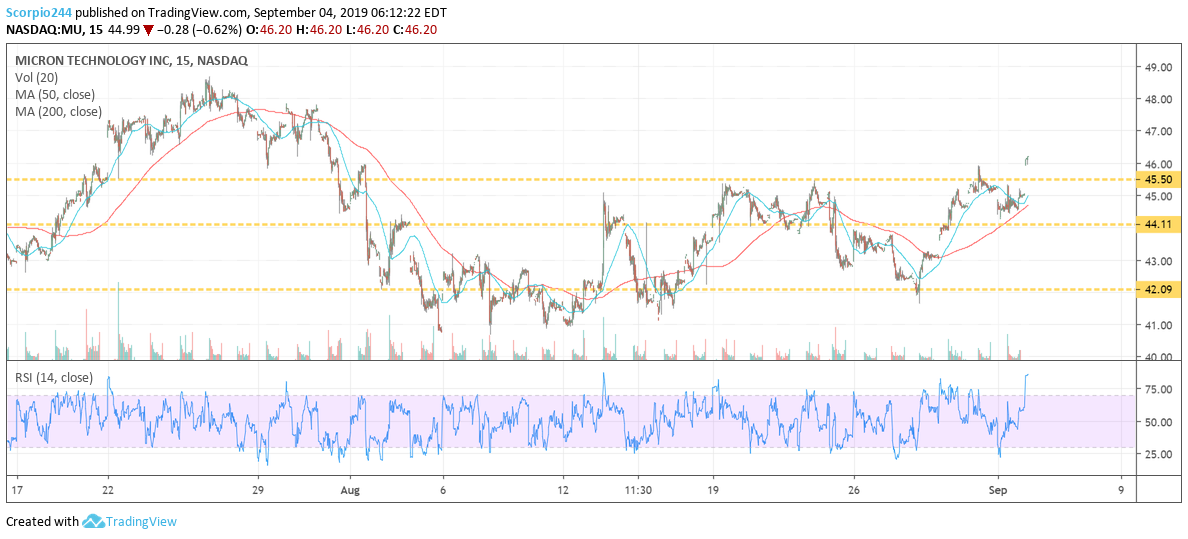
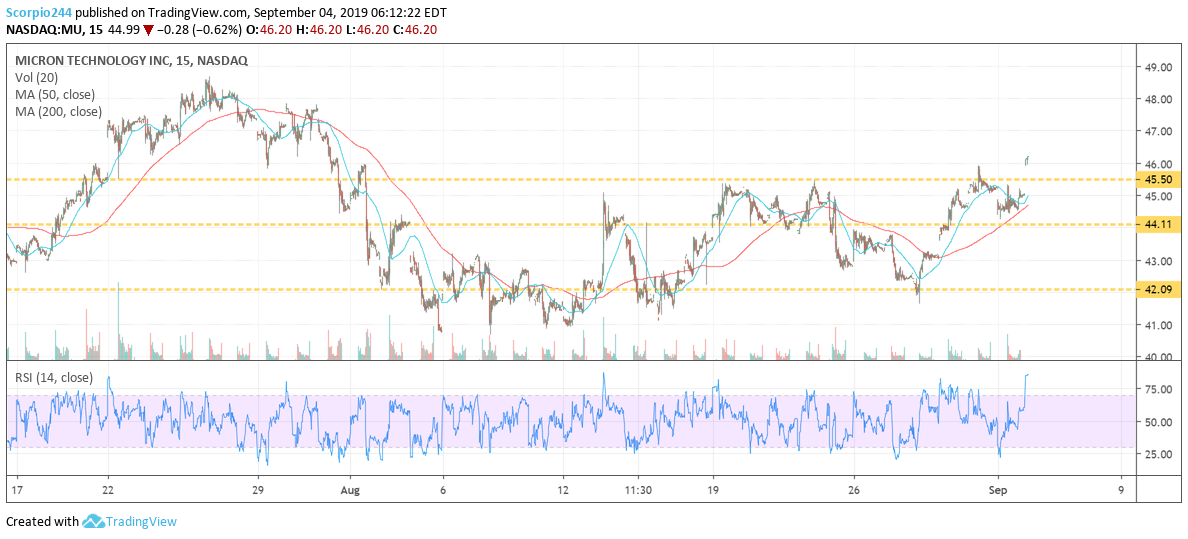
    Micron (NASDAQ:MU)

    MU Inc Chart

    Micron (NASDAQ:MU) is breaking out today, rising above its August resistance levels at $45.50. It sets up a jump to around $48.

    German 10-year
    DE10Y Chart

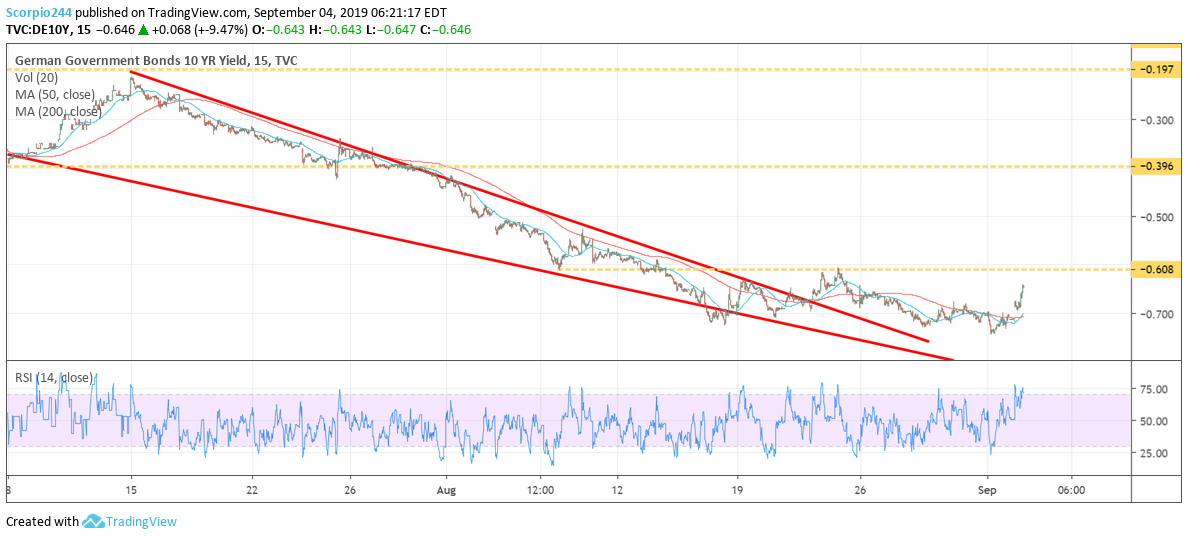
    In the meantime, look at German 10-Year yields rising towards negative 60 basis points.

    US/German Spread
    US10Y-DE10Y Chart

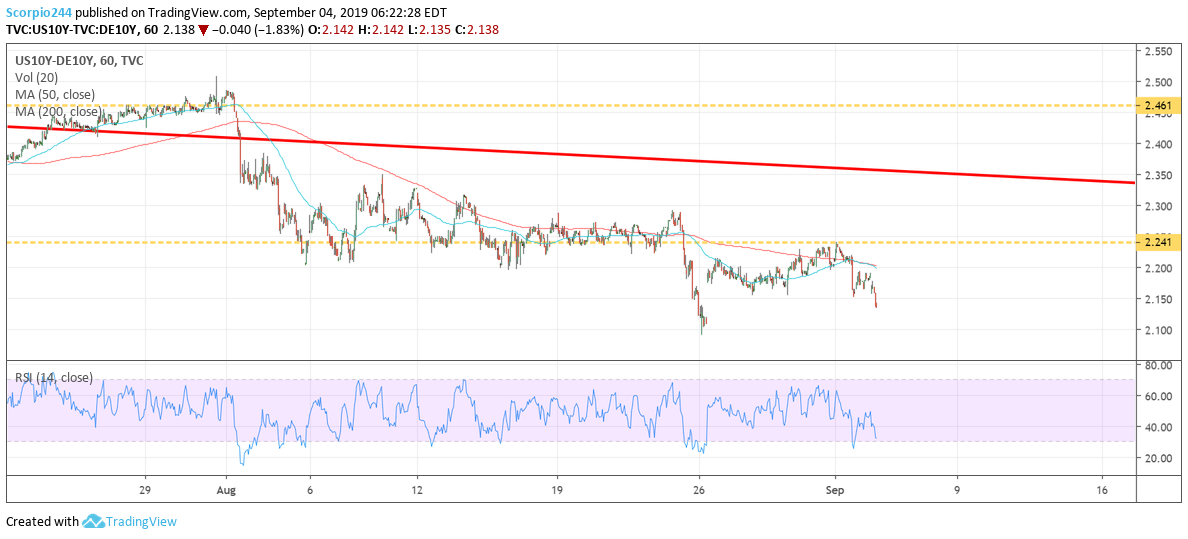
    Meanwhile, the spread between US and German 10-years is plunging once again and heading towards 2%.

    Dollar (DXY)

    Now, the dollar is weakening.
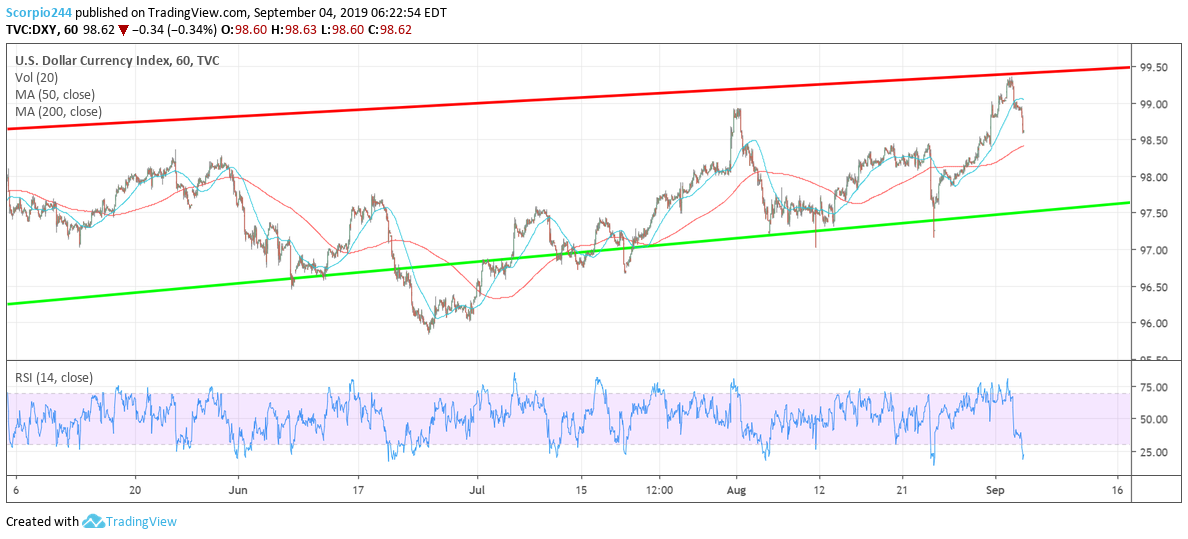
    USD Index

    Enjoy the day; suddenly, the glass is looking a little more half full.

    Original Post

    Latest comments

    hey
    Excellent article!
    Risk Disclosure: Trading in financial instruments and/or cryptocurrencies involves high risks including the risk of losing some, or all, of your investment amount, and may not be suitable for all investors. Prices of cryptocurrencies are extremely volatile and may be affected by external factors such as financial, regulatory or political events. Trading on margin increases the financial risks.
    Before deciding to trade in financial instrument or cryptocurrencies you should be fully informed of the risks and costs associated with trading the financial markets, carefully consider your investment objectives, level of experience, and risk appetite, and seek professional advice where needed.
    Fusion Media would like to remind you that the data contained in this website is not necessarily real-time nor accurate. The data and prices on the website are not necessarily provided by any market or exchange, but may be provided by market makers, and so prices may not be accurate and may differ from the actual price at any given market, meaning prices are indicative and not appropriate for trading purposes. Fusion Media and any provider of the data contained in this website will not accept liability for any loss or damage as a result of your trading, or your reliance on the information contained within this website.
    It is prohibited to use, store, reproduce, display, modify, transmit or distribute the data contained in this website without the explicit prior written permission of Fusion Media and/or the data provider. All intellectual property rights are reserved by the providers and/or the exchange providing the data contained in this website.
    Fusion Media may be compensated by the advertisers that appear on the website, based on your interaction with the advertisements or advertisers.
    © 2007-2024 - Fusion Media Limited. All Rights Reserved.