This year’s red-hot bond-market rally looks set for a new burst of bullish support if the Federal Reserve cuts interest rates today, which is widely expected.
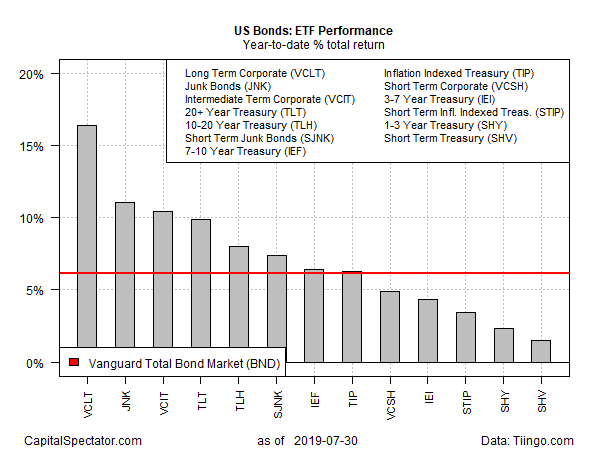
US fixed income is already sizzling, with every major component of the bond market posting year-to-date gains, based on a set of exchange-traded funds. The upside bias appears in no danger of faltering, given the outlook for today’s policy announcement from the Federal Reserve (scheduled for 2:00 pm Eastern). Fed funds futures are pricing in a near certainty of a rate cut, according to CME data. If correct, the central bank will roll out the first round of easing in more than a decade.
The bond market’s rally this year seems to have anticipated no less. Leading the bull run in 2019: long-term corporates and junk bonds.
Vanguard Long-Term Corporate Bond (VCLT) has gained 16.4% year to date through yesterday’s close (July 30)–nearly triple the fund’s 5-year annualized total return.
This year’s runner-up performer: SPDR Bloomberg Barclays High Yield Bond (JNK), which has jumped 11.1% so far in 2019.

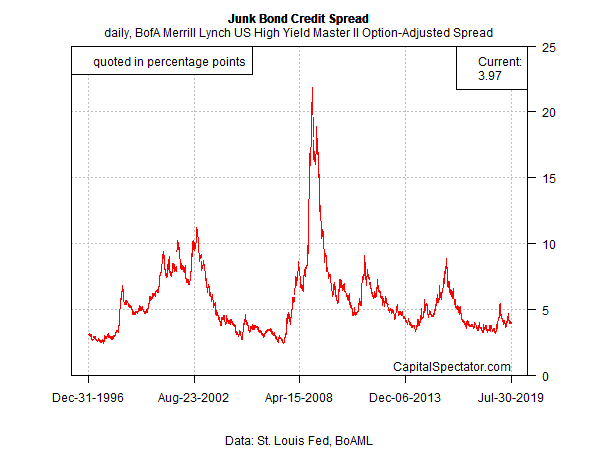
Bond prices are inversely related to yields and so it’s no surprise to see that recent history has delivered a hefty dose of yield compression. For example, the ICE BofAML Option-Adjusted Spread for high yield bonds, which tracks the spread for below-investment bonds over a spot Treasury curve, is close to its lowest point since the end of the last recession in 2009 – 3.97 percentage points, as of July 30. It’s an open debate if this spread (and others like it) can fall much further, although a rate cut today will juice forecasts for exactly that.

With the crowd assuming that the Fed will ease, the debate is focused on the wisdom of launching a new easing cycle.
“What the Fed is doing is unprecedented. There’s no historical precedent. There’s no example that with still above-trend growth and still above-trend labor growth has the Fed eased in the middle of an expansion,” says Ethan Harris, head of global economic research at Bank of America Merrill Lynch (NYSE:BAC). “This is a six-sigma event. If there were more clear evidence that the trade war was hurting, this would only be a small departure from normal but actually, the data in the last month has improved.”
Justified or not, a cut is now considered fate. “We may get a dissent or two, but it seems like a 25-basis-point cut is pretty much locked in,” opines Julia Coronado at MacroPolicy Perspectives.
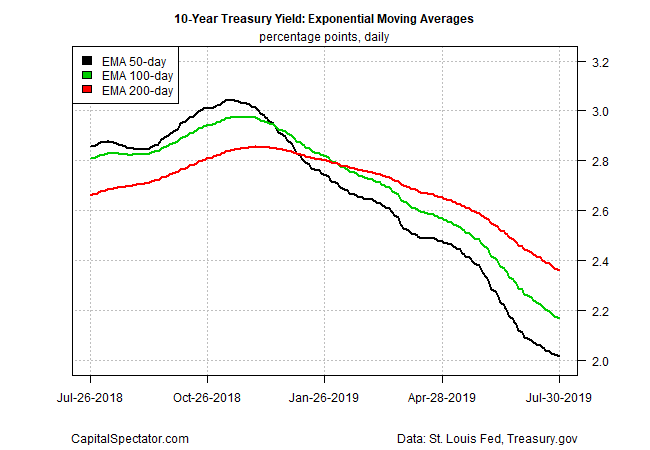
The benchmark 10-year Treasury yield has certainly been leaning in that direction for some time. Consider, for instance, a profile of this rate’s momentum in recent history, based on a set of exponential moving averages (EMAs). By this measure, a strong downside bias for the 10-year yield has been conspicuous all year.

Beyond the debate of whether the US economy needs a rate cut at this juncture is the question of whether a new policy easing will juice growth? Feeding the uncertainty on this issue is this morning’s update on newly issued mortgage applications to fund home purchases. The Mortgage Bankers Association’s seasonally adjusted index fell for a third straight week, despite falling interest rates of late.
“A Fed rate cut will have zero impact on the housing market,” predicts Tendayi Kapfidze, chief economist at Lending Tree. “Mortgage rates are already at three-year lows.”
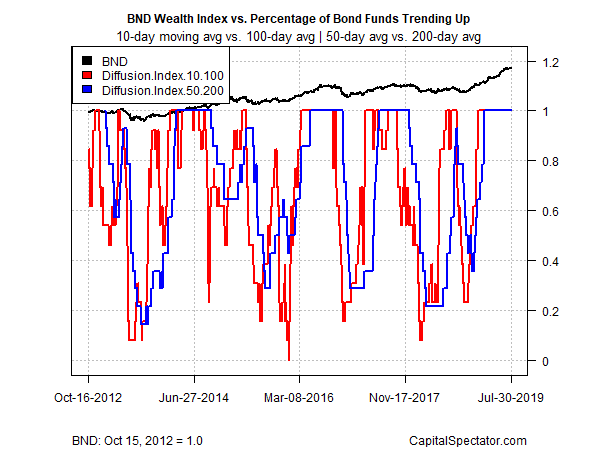
Economic policy debates aside, there’s no doubt that the bond market’s happy in the extreme. US fixed-income, it’s safe to say, is priced for perfection – and a rate cut or two. Using a pair of measures of the price trend for the funds listed above reminds that the rear-view mirror offers a view of bonds that’s about as good as it gets for the bulls.
The first metric compares each ETF’s 10-day moving average with the 100-day average — short-term trending behavior (red line in chart below). A second set of moving averages (50 and 200 days) offers an intermediate measure of the trend (blue line). The indexes range from 0 (all funds trending down) to 1.0 (all funds trending up). Using prices through yesterday’s close quantifies what should be obvious at this point: the bond market thinks the bearish case for fixed-income in the foreseeable future is the mother of all long shots.

