
Driven by rise in revenues, Texas Capital Bancshares Inc. (NYSE:C) reported a positive earnings surprise of 3.2% in second-quarter 2017. Earnings per share of 97 cents outpaced the Zacks Consensus Estimate by 3 cents. Moreover, the bottom line came in 24% higher than the prior-year quarter figure of 78 cents.
Better-than-expected results were driven by rise in revenues and lower provisions. Organic growth was reflected, with strong growth in loans and deposit balances. However, elevated expenses were the undermining factors.
Net income available to common shareholders was $48.7 million, up 33.8% year over year.
Revenue Growth Recorded, Loans & Deposits Go Up, Costs Escalate
Total revenue (net of interest expense) jumped 18% year over year to $201.8 million in the quarter, driven by higher net interest income and non-interest income in the quarter. Moreover, revenues surpassed the Zacks Consensus Estimate of $197.1 million.
Texas Capital’s net interest income was $182.9 million, up 16.5% year over year. In addition, net interest margin expanded 39 basis points (bps) year over year to 3.57%. This resulted from improvement in earning asset composition and the favorable impact of increased interest rates on loan yields.
Texas Capital’s non-interest income surged 35.3% year over year to $18.8 million. The rise was primarily due to an increase in service charges, servicing income, wealth management and trust fee income, along with other income.
However, non-interest expenses increased 18.6% year over year to $111.8 million. This was mainly stemmed by rise in almost all components of expenses.
As of Jun 30, 2017, total loans rose 13% year over year to $20.3 billion, while deposits climbed 3.6% year over year to $17.3 billion.
Credit Quality: A Mixed Bag
Non-performing assets totaled 0.73% of the loan portfolio plus other real estate owned assets, reflecting a year-over-year contraction of 31 basis points. Total non-performing assets came in at $142.4 million, down 22.7% year over year.
Provisions for credit losses summed $13 million, down 18.8% year over year. Non-accrual loans were $123.7 million or 0.64% of total loans, against $165.4 million or 0.93% in the year-ago quarter.
However, the company’s net charge-offs increased 3.3% on a year-over-year basis to $12.4 million.
Steady Capital and Profitability Ratios
The company’s capital ratios demonstrated a steady position. As of Jun 30, 2017, return on average equity was 10.08% and return on average assets was 0.96% compared with 9.65% and 0.77%, respectively, recorded in the year-ago quarter. Tangible common equity to total tangible assets came in at 8.4% compared with 7.2% in the prior-year quarter.
Stockholders’ equity was up 23.5% year over year to $2.1 billion as of Jun 30, 2017. The uptrend was chiefly allied with retention of net income and proceeds from common stock offering during fourth-quarter 2016.
Our Viewpoint
Texas Capital’s improved top line and a better balance sheet were impressive during the quarter. However, bleak economic situation may continue to hurt the company’s performance in the future. Though its inability to control expenses may hamper profitability going ahead, improvement in margin remains a favorable factor.
Texas Capital Bancshares, Inc. Price, Consensus and EPS Surprise
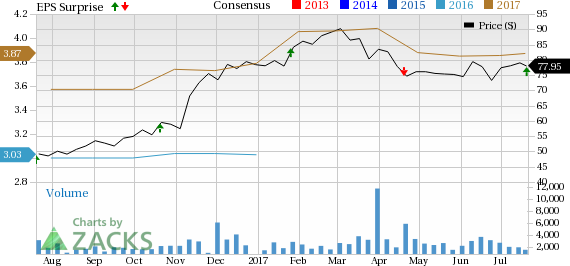
Texas Capital Bancshares, Inc. Price, Consensus and EPS Surprise | Texas Capital Bancshares, Inc. Quote
Currently, Texas Capital carries a Zacks Rank #3 (Hold). You can see the complete list of today’s Zacks #1 Rank (Strong Buy) stocks here.
Performance of Other Banks
Higher interest income drove Wells Fargo & Company’s (NYSE:WFC) second-quarter 2017 earnings which recorded a positive surprise of about 4.9%. Earnings of $1.07 per share outpaced the Zacks Consensus Estimate of $1.02. Moreover, the figure compared favorably with the prior-year quarter’s earnings of $1.01 per share.
Citigroup Inc. (NYSE:C) delivered a positive earnings surprise of 5.0% in second-quarter 2017, riding on higher revenues. The company’s income from continuing operations per share of $1.27 for the quarter outpaced the Zacks Consensus Estimate of $1.21. Also, earnings compared favorably with the year-ago figure of $1.25 per share.
Rising interest rates and loan growth drove JPMorgan Chase & Co.’s (NYSE:JPM) second-quarter 2017 earnings of $1.82 per share, which easily surpassed the Zacks Consensus Estimate of $1.57. Also, the figure reflects a 17% rise from the year-ago period. Notably, the results included a legal benefit of $406 million.
3 Top Picks to Ride the Hottest Tech Trend
Zacks just released a Special Report to guide you through a space that has already begun to transform our entire economy...
Last year, it was generating $8 billion in global revenues. By 2020, it's predicted to blast through the roof to $47 billion. Famed investor Mark Cuban says it will produce "the world's first trillionaires," but that should still leave plenty of money for those who make the right trades early. Download Report with 3 Top Tech Stocks >>
J P Morgan Chase & Co (JPM): Free Stock Analysis Report
Wells Fargo & Company (WFC): Free Stock Analysis Report
Citigroup Inc. (C): Free Stock Analysis Report
Texas Capital Bancshares, Inc. (TCBI): Free Stock Analysis Report
Original post
Zacks Investment Research