On the international currency markets there are further strengthening of the US dollar. As it was noted in yesterday's overview, as a result of the negative dynamics of the EUR/USD and GBP/USD quotes, prices came close to the area of the minimum values of the current year, observed in mid-August. In the case of completion of the formation of convergence between the minima and the corresponding values of the RSI and MACD indicators, which is expected in the next trading session, a correction movement can be observed in the market, the potential of which exceeds several hundred points.
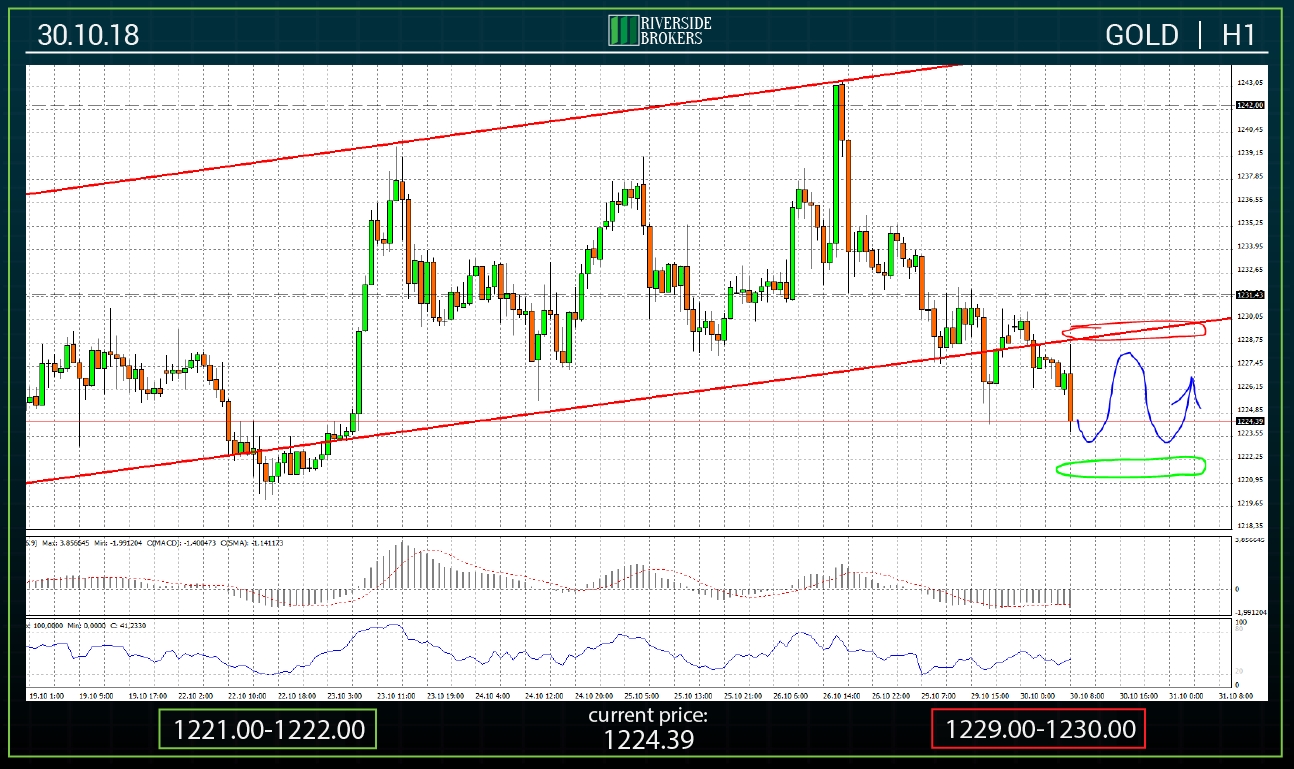
Otherwise, if the technical signals break down, the negative dynamics will continue. In the case of the implementation of the latter option, the head-shoulders pattern will be worked out on the daily time frame, which implies a decrease in the quotations of the analyzed pairs to areas of 1.0500-1.0600 and 1.2300-1.2500, respectively. The possibility of such a scenario was mentioned in a overview dated June 9 of this year. However, at the moment, I remain on the point of view, according to which the market has matured for the corrective movement. Of the rest of the financial instruments analyzed in the overview, we can note the dynamics of the gold quotations, which broke through the lower limit of the medium-term channel near the mark of 1229.00 and are located on Tuesday morning around 1223.00-1224.00. Further price cuts will lead to testing support around 1221.00-1222.00. In case of its breakout, prices may drop to 1200.00.
Today, from the published statistics, it can be noted the data on the labor market and consumer inflation in Germany. The last of the indicators will allow to predict consumer inflation in the Eurozone as a whole, which will clarify the overall picture of inflation in the European economy. In addition, today there are preliminary data on Eurozone GDP for the 3rd quarter. Market expectations are at 1.9% in annual terms. In the case of weak statistics on the market will be another wave of weakening of the European currency.
EUR/USD
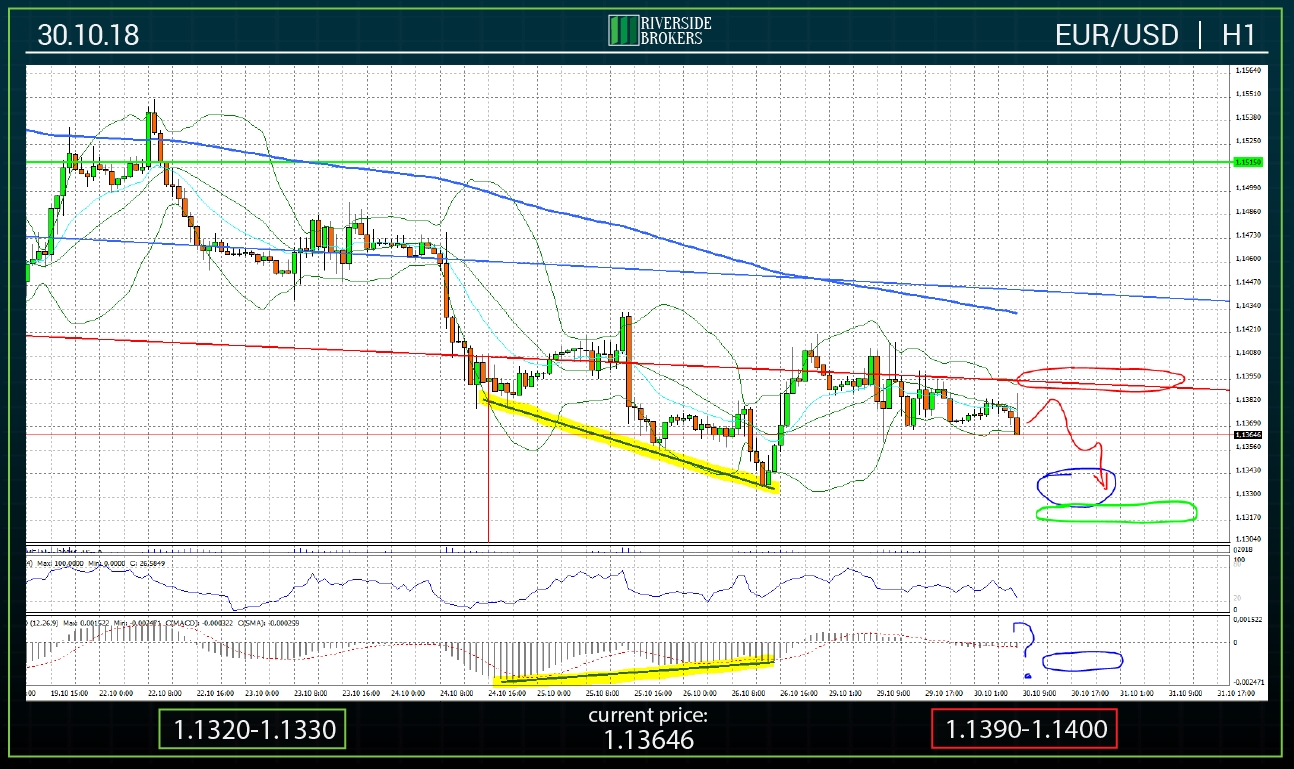
At the auction on Monday, the lateral dynamics of the EUR/USD pair quotations prevailed. Prices have stabilized in the area below 1.1400, in anticipation of important statistics, published today and in the following days of the week. In the case of a negative scenario and updating of the minimum values of Friday around 1.1330-1.1340, it is important the answer to the question, whether the signal of a corrective nature is formed - convergence between the minima and the values of the MACD indicator, or not. On the chart, this situation is indicated by a question mark in the indicator field. In the case of a positive response, we can assume correctional movement in order to increase to the upper limit of the medium-term channel in the region of 1.1435-1.1450. At the same time, as noted above, in the case of continued strengthening of the US currency, the first plan is testing the area of minimum prices of the current year and tracking the possible formation of convergence on the daily time frame.
Areas of support and resistance are areas 1.1320-1.1330 and 1.1390-1.1400, respectively.
GBP/USD
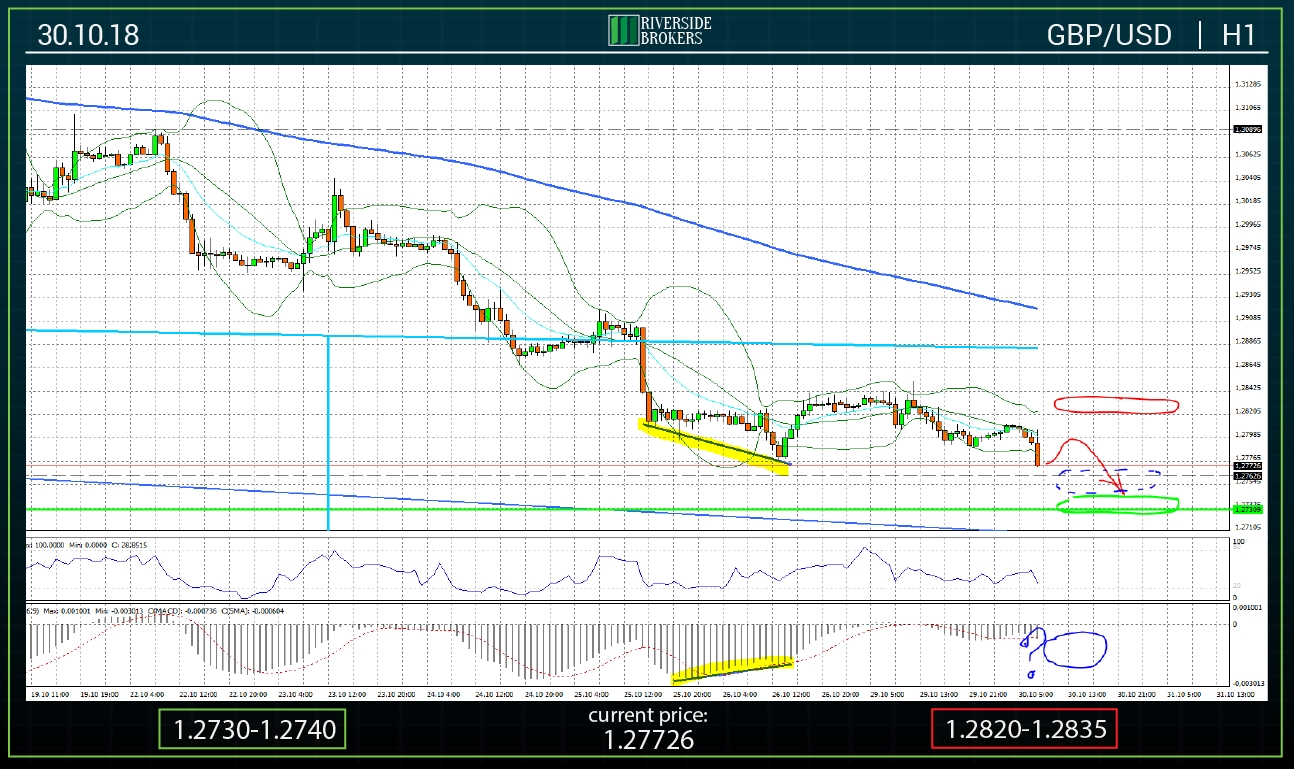
At the time of writing, the quotes of GBP/USD have updated the minimum values of Monday and fell to the level of 1.2772. The negative dynamics is a consequence of the general tendency of the dollar to strengthen in global currency markets. In addition, the braking of the negotiation process on Brexit also contributes. However, from my point of view, the probability of a further strong decline in trading today or tomorrow is small, because the players will prefer to take a cautious position on the eve of The Bank of England meeting on Thursday. Similar to the previous pair EUR/USD on the chart of GBP/USD pair in the field of MACD indicator there is a question mark of the possibility of forming a correction signal-convergence between the local lows of prices and the values of the indicator. In the case of a positive response, we can expect the cessation of negative dynamics today.
Summarizing the above, today it is assumed that prices will stabilize in the region just below 1.2800.
The support zone is located at 1.2730-1.2740 (green oval).
The resistance zone is in the range of 1.2820-1.2835 (red oval).
USD/JPY
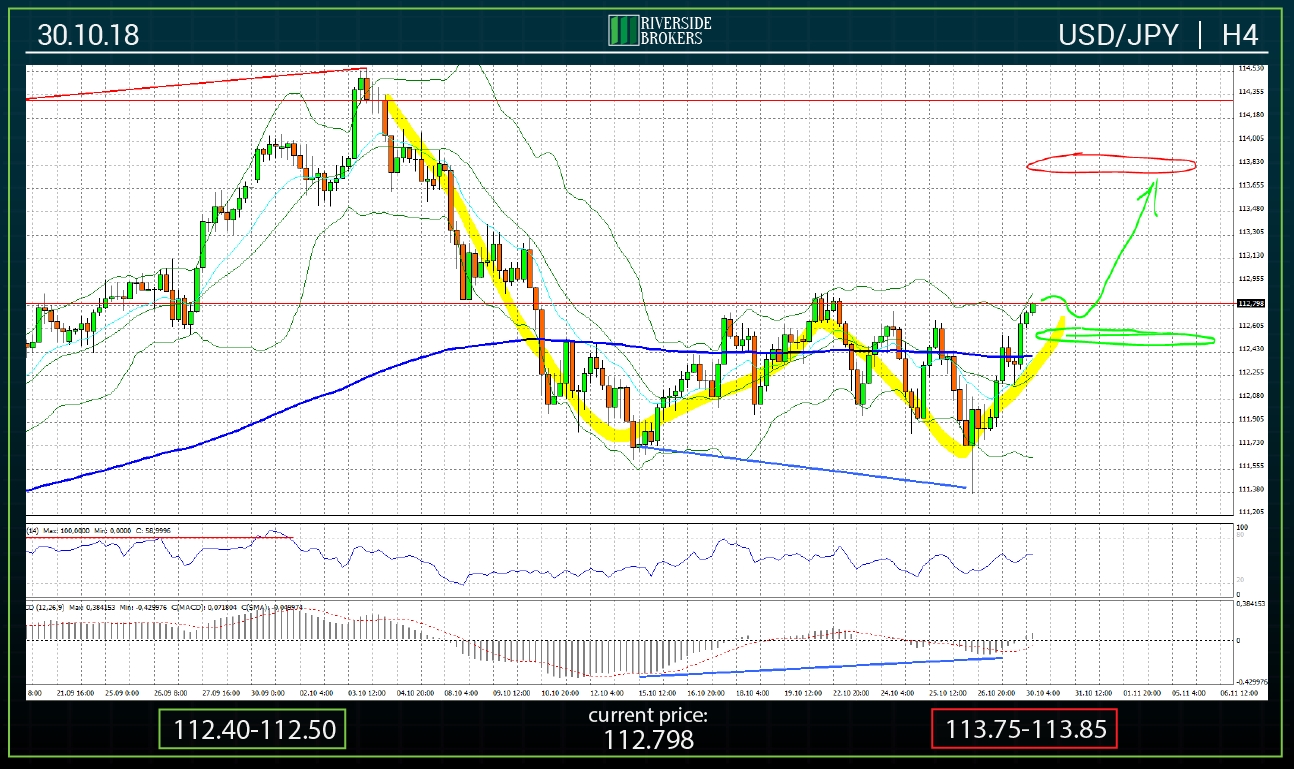
The USD/JPY pair has worked a correction signal - a convergence between the lows of prices and the values of the MACD indicator. The quotes were rebound from the 112.00 mark and are in the early hours of Tuesday around 112.70-112.80. It is worth noting that on the attached graphic, a yellow color marker shows an emerging “double bottom” figure, the neckline of which is located in the current price area. In case of further positive dynamics and breakout of this line, we can assume the growth of quotations to the area of 113.60-113.80, where the resistance zone is located. However, it is worth recalling that tomorrow the next meeting of the Bank of Japan will be held, the results of which may have a significant impact on the pair. Under these conditions, players can take a wait and see attitude, which will lead to sideways dynamics of quotes.
The support zone today is the range 112.40-112.50 (green oval).
The resistance zone is located in the area of 113.75-113.85 (red oval).
USD/CHF
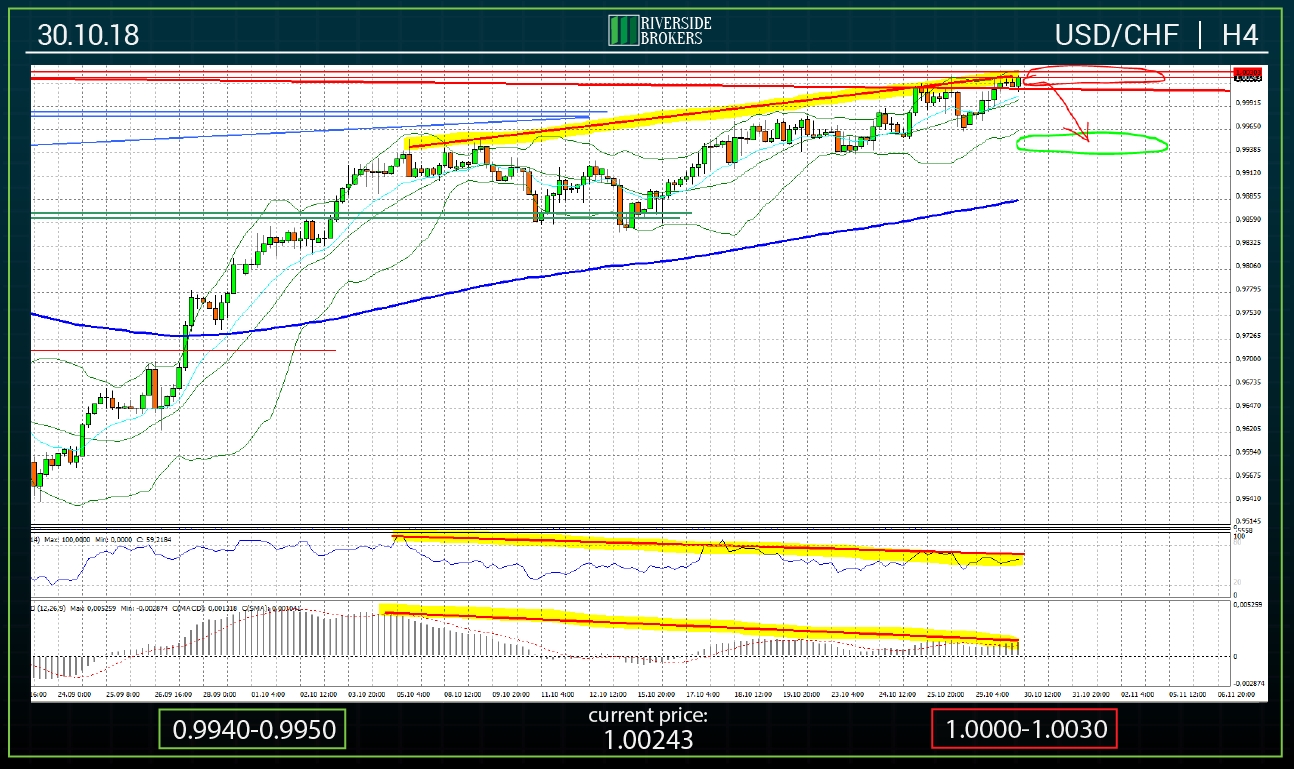
In the USD/CHF pair, the technical picture has remained unchanged over the past few days. Despite the gradual weakening of the Swiss franc against the dollar, as a result of which today the quotes are above the parity mark, from a technical point of view there is still a divergence between local price maxima and RSI and MACD values. This fact allows us to stay on the previously stated point of view on the probability of a corrective decline in quotations. The long-term contradiction between the observed price dynamics and the signals of technical analysis should be resolved in the near future.
Support and resistance zones are located at 0.9940-0.9950 (green oval) and 1.0000-1.0030 (red oval), respectively.
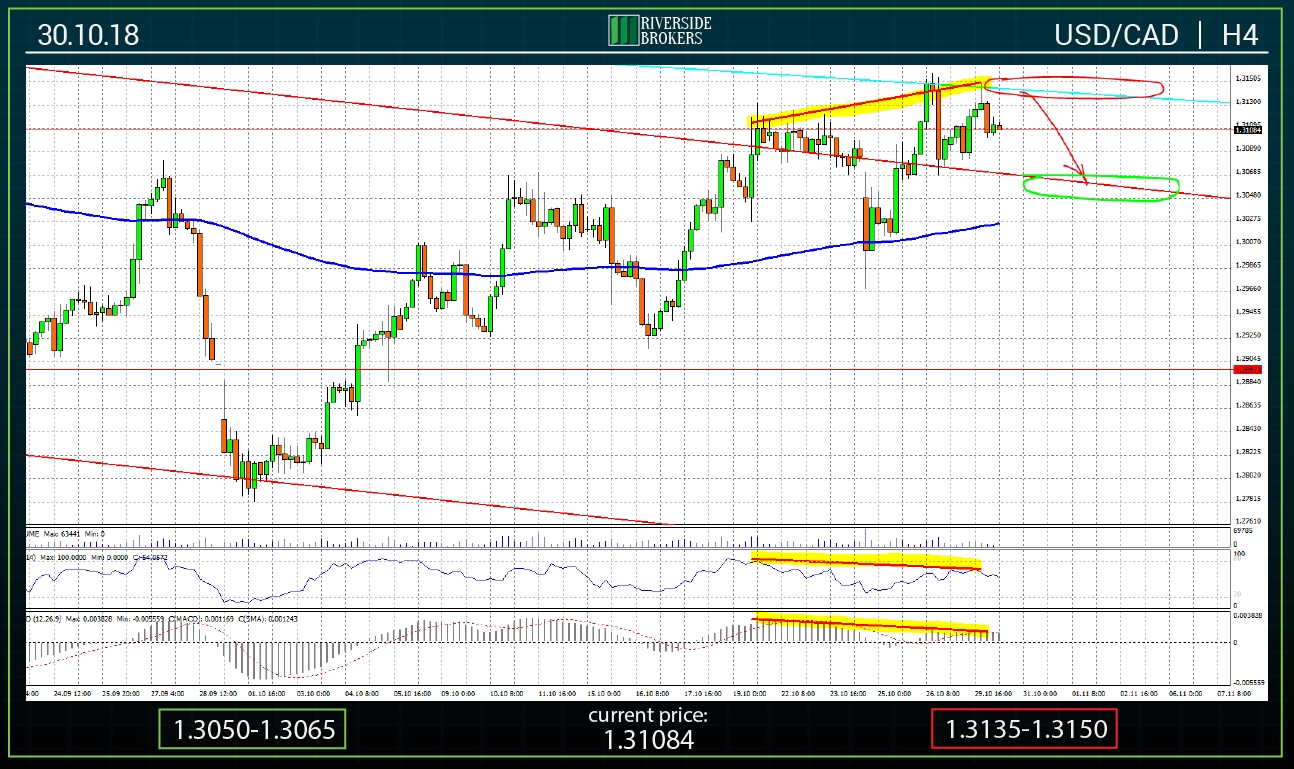
In yesterday's trading, the pair USD / CAD tested for the second time the strength of the multi-year resistance line passing through the 1.3150 mark. At the same time, the prolongation of the divergence between the maximum prices and the corresponding values of the RSI and MACD indicators was recorded, which indicates the probability of a decline in quotations to the upper limit of the medium-term channel located in the region1.3050-1.3065. However, today, during the day, new attempts to break through the indicated resistance zone, which in my opinion will be unsuccessful, are not excluded.
The support zone is in the range of 1.3050-1.3065 (green oval).
Resistance is still located at 1.3135-1.3150 (red oval).
Yesterday, during the bidding process, gold quotes broke through the lower limit of the medium-term channel near the mark of 1229.00 and are in the area of 1223.50-1224.50. Today, the prevalence of lateral dynamics is predicted with periodic attempts to return prices to the inner area of this channel.
Below the quotes are supported by the area of minimum prices observed on October 22-23 in the area of 1221.00-1222.00 (green oval).
Resistance is the lower boundary of the channel, passing through the range 1229.00-1230.00 (red oval).
