Get 40% Off
🚨 Volatile Markets? Find Hidden Gems for Serious OutperformanceFind Stocks Now

Tesla’s Run To $600 Is Underway

Published 11/20/2020, 04:03 PM
Updated 07/09/2023, 06:31 AM

In my article from three days ago, I concluded from my objective Elliott Wave Principle (EWP) and technical analysis that:

if Tesla (NASDAQ:TSLA) can hold at least $428, and from an EWP-perspective $380 ultimately, it has completed a larger 4th wave as a (tricky) triangle and can (then) move higher to ideally $535-550, possibly as high as the low $600s to complete wave-5 of larger wave-III/C.”

It bottomed at $433 that day and is now already trading more than 12% higher since I wrote my article. Had one followed my advice, “Tesla is moving higher to certain mathematically calculated price-levels (target) and to get there it should not break below certain price levels (stop). That is the actionable take-away, and all we really need to know,” one would have made a pretty penny very quickly and easily. Isn’t that what this is all about? On my private twitter trading feed we are banking nicely from my work as this is as easy as trading can get.

So, what is next?

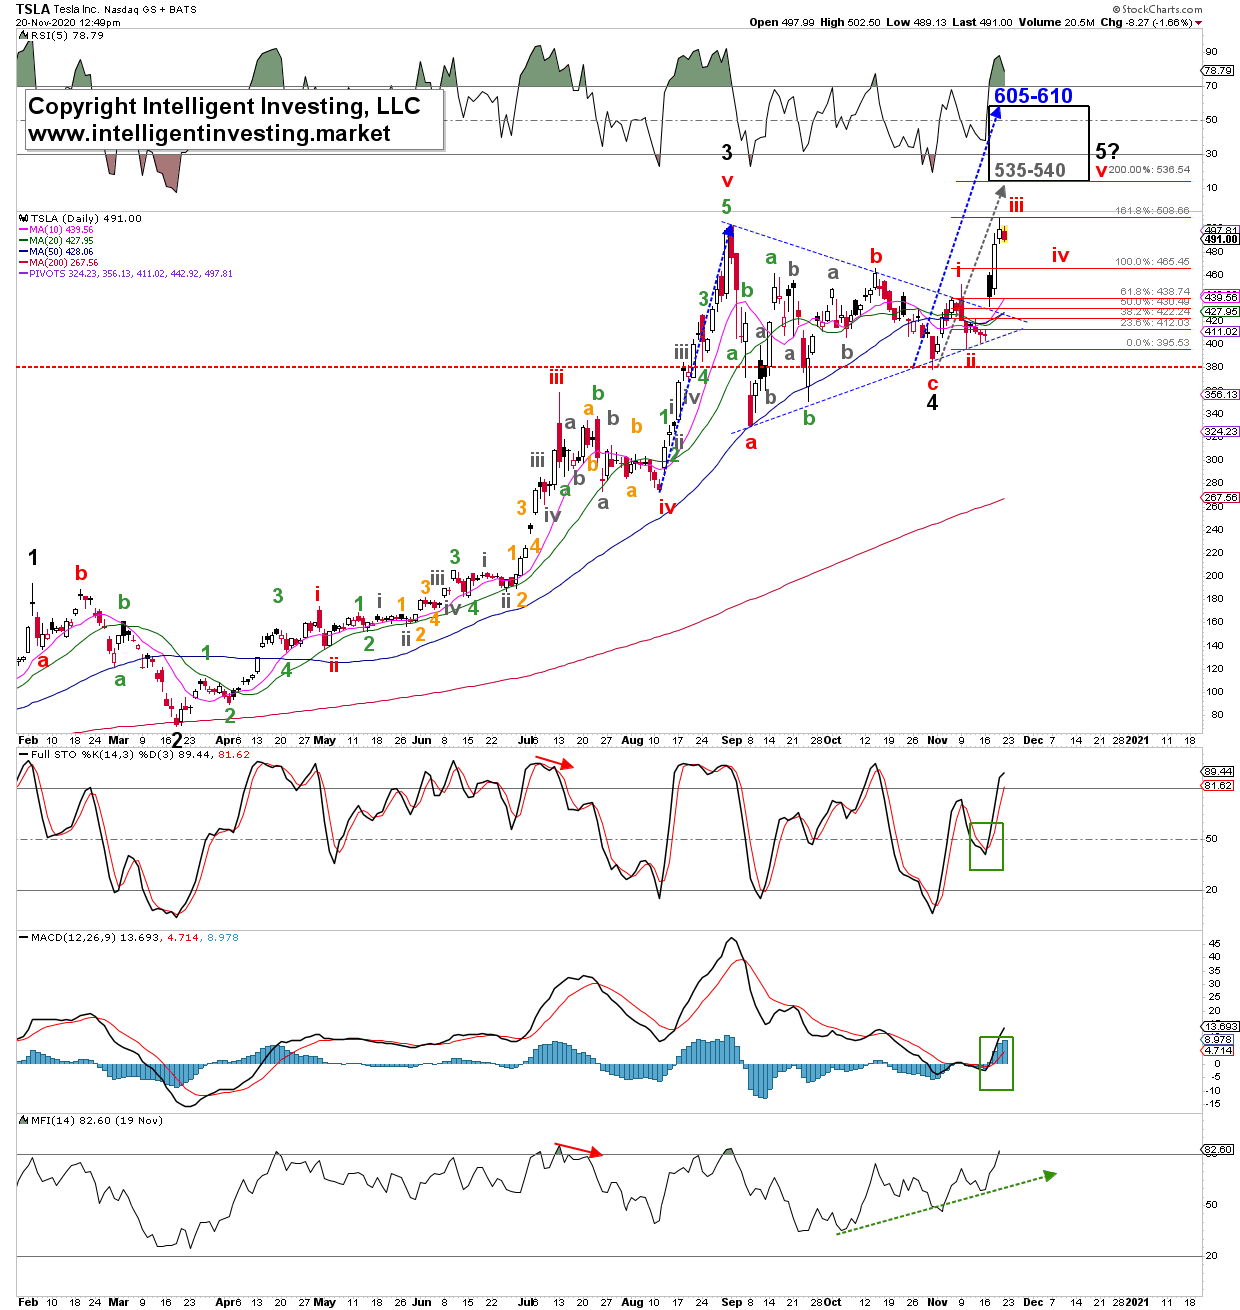
The daily chart below shows price has already reached the 1.618x Fib-extension yesterday at $509; a typical 3rd wave extension target, and should now correct for a smaller (red) wave-iv to ideally $480-465 before moving higher to at least–and ideally–$535+. It has the possibility to move to $600+ as well if red wave-v decides to extend. We will deal with that when we get there. For now, the focus is on this red wave-iv.

Figure 1: TSLA daily candle stick chart with detailed Count
3rd party Ad. Not an offer or recommendation by Investing.com. See disclosure here or remove ads .

Tesla Daily Candlestick Chart With Detailed EW Count.

Bottom line: Tesla is moving along as expected and should now be in a short-term correction to alleviate some of the overbought conditions before moving higher to at least $535. Tuesday’s technical breakout, indicator-based buy signals, and EWP count all supported higher prices, as Tesla never moved below $428. If anything, Tuesday was a buying opportunity. For now, Tesla is following along classic EWP-patterns and Fibonacci-levels. Therefore, I see no reason to change my bullish point of view, which has, in fact, only been bolstered by the recent price action, unless it closes below $452 (labelled as the red wave-i high made Nov. 9), from current levels. Thus, if anything, the current pullback represents another buying opportunity for those who may have missed the boat. And a clear well-defined stop level of $452 can be used.

Latest comments

Wow! What do you say? 550-ish now already! Super again Doc.
607 dollar. Let’s see what tappens now.
One day, that stock will drop like a stone.. Tesla is overrated versus other cars brands!
One day, that stock will drop like a stone.. Tesla is totally insane overrated versus other cars brands!
Its not about the car, its about the whole Tesla and future vision of the company
Technical analysis is nothing but pseudoscience. It has no inherent truth or validity except that if enough people determine the support and resistance levels of price action using it, then it'll come true as a self-fulfilling prophecy. At best, it tells you what points to set your buy/sell stop limits at because everyone else trades according to these levels. At worst, it is completely unfalsifiable as a science and hence a favorite of snake oil salesmen to con naive investors into thinking it has predictive power when in reality, it has as much of it as an octopus does in predicting soccer world cup winners.
I'd rather just pump BLNK.. EV charging company
when this Tesla cult stops with the music there are not enough chairs to everybody
Disrespects
What a genius! Lol
Nio & XPeng overtaking electric car market is underway.
Market cheerleaders are cute.
but NIO and Xpeng have their EPS negative. how confident you buy the stocks with negative EPS.. just asking .
If future stock prices can be determined by one person's interpretation of Elliott Wave Theory then why do professionals look at things like earnings growth, value, momentum and comparisons to peers? I obviously must be very lucky to earn very reasonable returns/risk without knowing squat about Elliott Wave.
Turk, I partly agree with you as I 90% play w/ fundamental analysis. However, when a "speculative trend takes place EWP, Fib and TA gives a good guess (by experience). Just because the crowd acts in pulses and there is some logic behind that.
Same here good response Turk. Destroying bears and making money is the name of the game.
Risk Disclosure: Trading in financial instruments and/or cryptocurrencies involves high risks including the risk of losing some, or all, of your investment amount, and may not be suitable for all investors. Prices of cryptocurrencies are extremely volatile and may be affected by external factors such as financial, regulatory or political events. Trading on margin increases the financial risks.
Before deciding to trade in financial instrument or cryptocurrencies you should be fully informed of the risks and costs associated with trading the financial markets, carefully consider your investment objectives, level of experience, and risk appetite, and seek professional advice where needed.
Fusion Media would like to remind you that the data contained in this website is not necessarily real-time nor accurate. The data and prices on the website are not necessarily provided by any market or exchange, but may be provided by market makers, and so prices may not be accurate and may differ from the actual price at any given market, meaning prices are indicative and not appropriate for trading purposes. Fusion Media and any provider of the data contained in this website will not accept liability for any loss or damage as a result of your trading, or your reliance on the information contained within this website.
It is prohibited to use, store, reproduce, display, modify, transmit or distribute the data contained in this website without the explicit prior written permission of Fusion Media and/or the data provider. All intellectual property rights are reserved by the providers and/or the exchange providing the data contained in this website.
Fusion Media may be compensated by the advertisers that appear on the website, based on your interaction with the advertisements or advertisers.
© 2007-2024 - Fusion Media Limited. All Rights Reserved.