Get 40% Off
🚨 Volatile Markets? Find Hidden Gems for Serious OutperformanceFind Stocks Now

Tesla Trades In A Corrective Manner

Published 02/24/2021, 06:58 AM
Updated 07/09/2023, 06:31 AM

Tesla (NASDAQ:TSLA) opened with a large gap to the downside on Tuesday and continued trading south for a while. That said, the stock hit support at 619.00 and throughout the session, it managed to claw back most of its early losses.

Overall, Tesla continues to trade above the upside support line drawn from the low of June 26, 2020, as well as above a longer-term line, taken from the low of Mar. 18, 2020. In our view, this keeps the overall outlook positive. However, since the Feb. 8, the stock has been drifting lower, below a downside resistance line, which means that the stock is currently in a corrective phase.

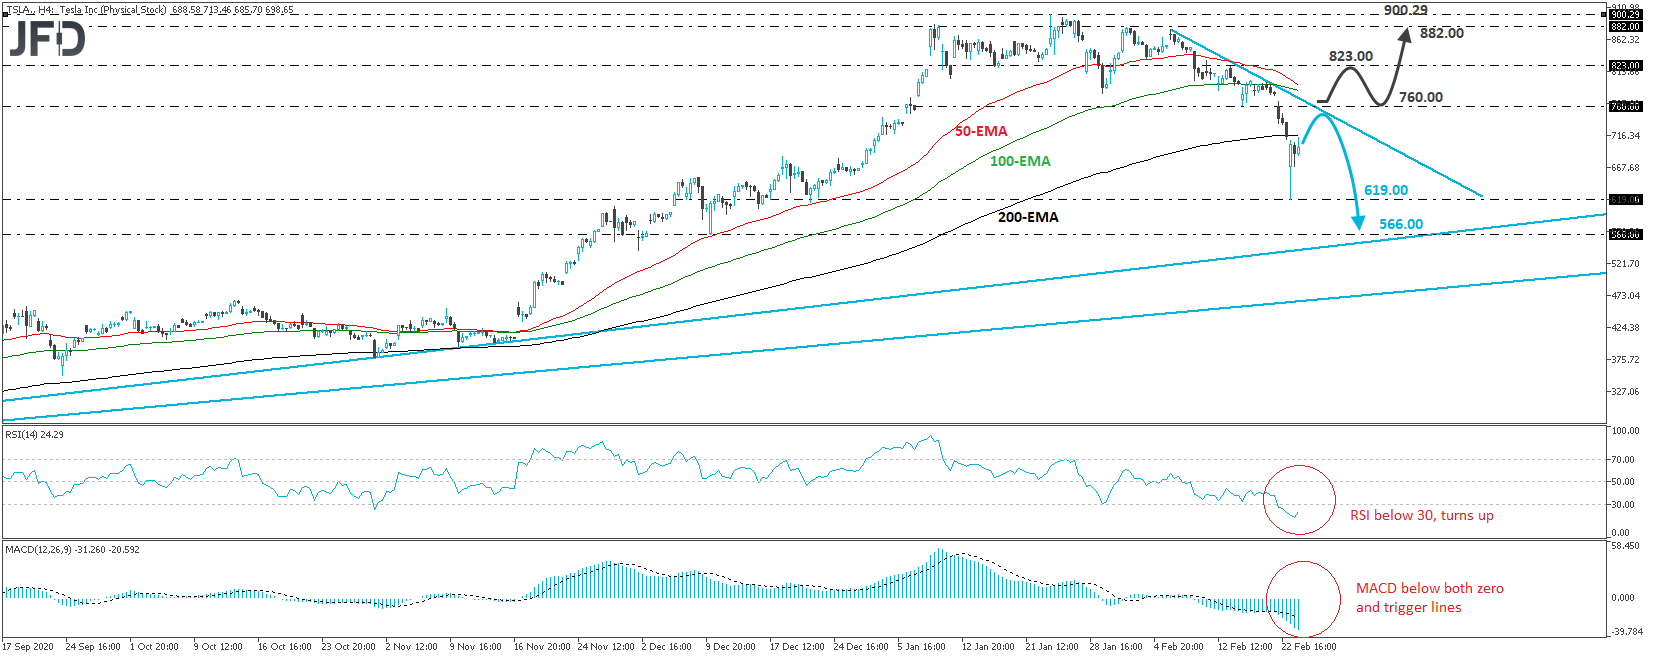
Despite yesterday’s rebound from 619.00, the share price remains below the short-term downside line, which suggests that the correction may not be over. If the bears manage to take charge from below that line, we expect them to aim for another test at 619.00, the break of which could extend the slide towards the low of Dec. 10, at 566.00, or the upside line drawn from the low of June 26, 2020.

Shifting attention to our short-term oscillators, we see that the RSI runs below 30, but has just ticked up, while the MACD lies below both its zero and trigger lines. Both indicators detect strong downside speed, but the fact that the RSI turned up suggests that some further recovery may be in the works before the next leg south.

In order to start examining whether the prevailing longer-term uptrend is back in force, we would like to see a strong break above 760.00, marked by the low of Dec.17. This may also take the stock above the pre-discussed short-term downside line and may initially pave the way towards the high of the day before, at 823.00. Another break, above 823.00, could extend the advance towards the 882.00 area, marked by the high of Feb. 2, or towards the record peak of 900.29, hit on Jan. 25.
Tesla stock 4-hour chart technical analysis

3rd party Ad. Not an offer or recommendation by Investing.com. See disclosure here or remove ads .

Latest comments

Risk Disclosure: Trading in financial instruments and/or cryptocurrencies involves high risks including the risk of losing some, or all, of your investment amount, and may not be suitable for all investors. Prices of cryptocurrencies are extremely volatile and may be affected by external factors such as financial, regulatory or political events. Trading on margin increases the financial risks.
Before deciding to trade in financial instrument or cryptocurrencies you should be fully informed of the risks and costs associated with trading the financial markets, carefully consider your investment objectives, level of experience, and risk appetite, and seek professional advice where needed.
Fusion Media would like to remind you that the data contained in this website is not necessarily real-time nor accurate. The data and prices on the website are not necessarily provided by any market or exchange, but may be provided by market makers, and so prices may not be accurate and may differ from the actual price at any given market, meaning prices are indicative and not appropriate for trading purposes. Fusion Media and any provider of the data contained in this website will not accept liability for any loss or damage as a result of your trading, or your reliance on the information contained within this website.
It is prohibited to use, store, reproduce, display, modify, transmit or distribute the data contained in this website without the explicit prior written permission of Fusion Media and/or the data provider. All intellectual property rights are reserved by the providers and/or the exchange providing the data contained in this website.
Fusion Media may be compensated by the advertisers that appear on the website, based on your interaction with the advertisements or advertisers.
© 2007-2024 - Fusion Media Limited. All Rights Reserved.