Get 40% Off
🚨 Volatile Markets? Find Hidden Gems for Serious OutperformanceFind Stocks Now

Tesla Hits Technical Target At $610; Traders May Look To Buy On Dips

Published 12/08/2020, 12:17 AM
Updated 07/09/2023, 06:31 AM

For those who follow such things, the “World’s Richest People” list has seen a dramatic shakeup this year. Many of the familiar names (Bezos, Gates, Arnault, Zuckerberg, Buffett, etc) remain in the Top 10, but Tesla’s eccentric CEO Elon Musk has seen his wealth balloon to nearly $150B on the back of the huge rally in Tesla stock to propel him all the way up to #2 overall. With TSLA (finally) set to be formally added to the S&P 500 before markets open on 21 December, what are the prospects for the hotly-debated electric automaker moving forward?

From a fundamental perspective, Tesla (NASDAQ:TSLA) is the quintessential growth stock. In other words, the company has low revenue and profit figures relative to its current price, with traders more focused on the firm’s future prospects and total addressable market. Based on analysts’ estimates for the next twelve months, TSLA sports a P/E ratio of 160 and P/S ratio of 13; by way of comparison, Tesla’s valuation is ~25X higher than the equivalent ratios for General Motors (NYSE:GM), a far more established and profitable automaker, at 6.7 and 0.5 respectively.

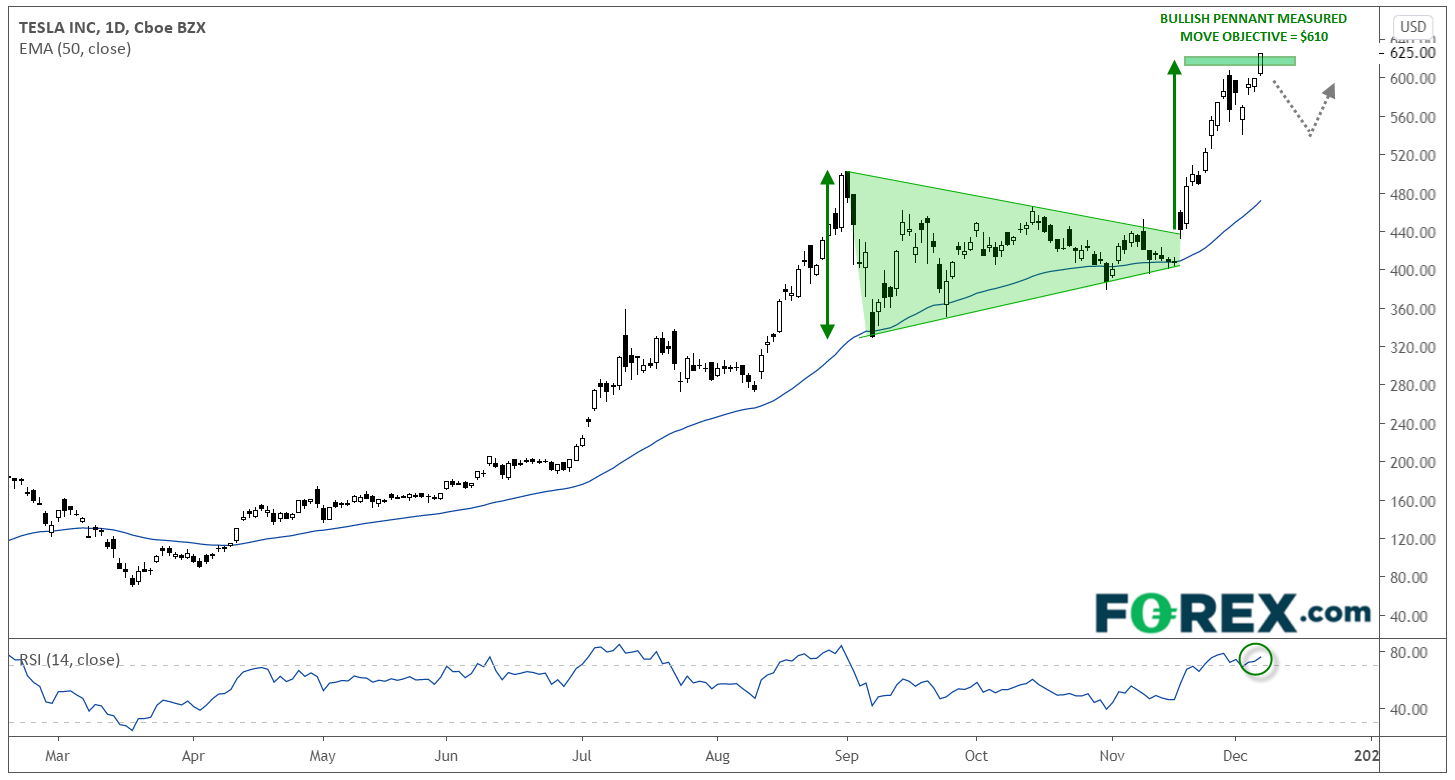
Turning to the chart, the only thing more incredible than Tesla’s sky-high valuation ratios is the strength of its current uptrend. Since bottoming near $70 in mid-March, TSLA has surged nearly 800% to trade above $620. The most relevant technical features of the chart are the 50-day exponential moving average, which has consistently provided support over the past nine months, and the bullish pennant formation from September and October. The mid-November breakout from that pattern created a “measured move” price objective near $610:
3rd party Ad. Not an offer or recommendation by Investing.com. See disclosure here or remove ads .

Tesla Inc Daily Chart

With prices reaching that technical objective this morning and trading well above the 50-day EMA, it wouldn’t be surprising to see the stock pause or pullback into the $500s in the coming days. That said, TSLA remains in a strong uptrend, and with many funds trying to “window dress” their portfolios ahead of end-of-year communications, readers could consider buying on short-term dips as long as the 50-day EMA continues to provide support.

After all, Elon Musk becoming the richest person on the planet seems like an oddly apropos development for the bizarre, unprecedented year we’ve lived through thus far!

Original Post

Latest comments

and thanks, please post when a pullback is ongoing, bottoming out, it will help traders (yes, it is extended now, high risk)
Bears have doubted Elon and Tesla since the begining. It warms my heart to see shorts suffer dramatically for years betting against TSLA.
schadenfreude
thanks...the bizar re is that while nations are in-depth, the rich who live on hard workers, are not asked to give away to the starving children in Yemen ++ who die from lack of simple medicine, Sir P McCartney... is the worst cause he got his best songs for free (he is not thankful) , he is not asked to give back, so he is not really a nice person... where is the humanity of the Sir, folks : ask them give
Risk Disclosure: Trading in financial instruments and/or cryptocurrencies involves high risks including the risk of losing some, or all, of your investment amount, and may not be suitable for all investors. Prices of cryptocurrencies are extremely volatile and may be affected by external factors such as financial, regulatory or political events. Trading on margin increases the financial risks.
Before deciding to trade in financial instrument or cryptocurrencies you should be fully informed of the risks and costs associated with trading the financial markets, carefully consider your investment objectives, level of experience, and risk appetite, and seek professional advice where needed.
Fusion Media would like to remind you that the data contained in this website is not necessarily real-time nor accurate. The data and prices on the website are not necessarily provided by any market or exchange, but may be provided by market makers, and so prices may not be accurate and may differ from the actual price at any given market, meaning prices are indicative and not appropriate for trading purposes. Fusion Media and any provider of the data contained in this website will not accept liability for any loss or damage as a result of your trading, or your reliance on the information contained within this website.
It is prohibited to use, store, reproduce, display, modify, transmit or distribute the data contained in this website without the explicit prior written permission of Fusion Media and/or the data provider. All intellectual property rights are reserved by the providers and/or the exchange providing the data contained in this website.
Fusion Media may be compensated by the advertisers that appear on the website, based on your interaction with the advertisements or advertisers.
© 2007-2024 - Fusion Media Limited. All Rights Reserved.