Get 40% Off
⚠ Earnings Alert! Which stocks are poised to surge?
See the stocks on our ProPicks radar. These strategies gained 19.7% year-to-date.
Unlock full list

Tesla Correction Continues: How Low Can It Go?

Published 09/11/2020, 03:11 PM

In my previous update (see here), when Tesla (NASDAQ:TSLA) was trading at ~$410, my preferred view was, based on the Elliott Wave Principle (EWP) technical analysis, and the technical indicators, “As long as this week’s high is not exceeded, I prefer to look lower, knowing there will likely be several twists and turns along the way down.” And that “black, major, wave-3 topped, and major wave-4 is now under way …. [which] should ideally fall back to around $280-340 before wave-5 kicks in. A loss of the $270 level will be a severe warning Tesla has put in a much larger top.

One week later, and the stock is trading at around $365—a loss of 11% since my update on Sept. 3. Thus looking for lower prices was indeed correct. If one had bought Tesla on Aug. 31 at the open, when it started trading at its new split-adjusted share price, one would now be down almost 20% if one had no stop loss in place. Thus, the rally before the stock-split was as many would call a “buy the rumor, sell the news” type of event. In EWP terms, it was a fifth wave.

Figure 1:
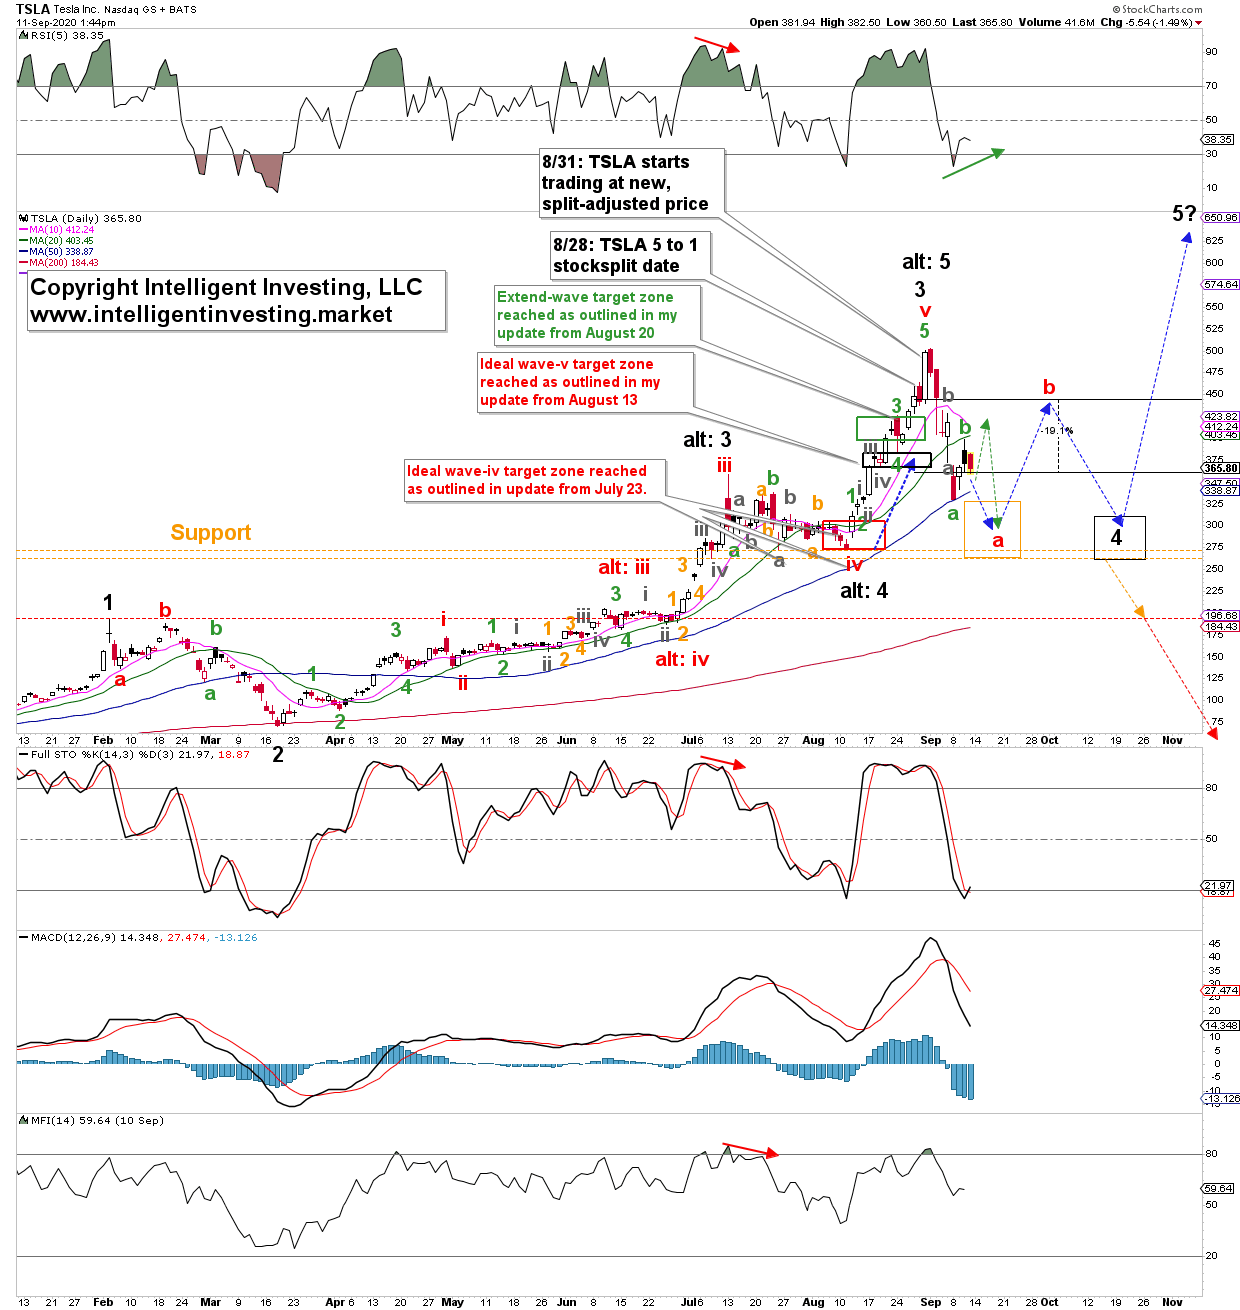
Tesla Daily Chart.

What’s next for Tesla? Corrections are always the most tricky to correctly forecast as they can take on many forms: triangle, zigzag, flat. See here for a basic explanation. The backbone is three waves: a, b, c. Corrections can always become more complex with seven or nine, etc. waves. It is impossible to know beforehand, which form the correction will take and how many waves it will do. Still, once the initial move down has completed, as it has now, I can give a more reliable forecast of what to expect next.

My expectation is for Tesla to complete a larger (Red) wave-a in the orange target zone (~$275-325), rally back to resistance (~$450) for wave-b and then a final wave-c back down to $280-340 to complete wave-4. See blue arrows. Shorter-term Tesla can take a little detour first, by rallying to around $410, and then drop to the red wave-a target zone. See green arrows. It is at this stage unknown which exact path will be taken. When things are uncertain, I recommend staying out. But that’s just me.

As you can see, I placed an alternate EWP count on the chart as well (black alt: 3, 4, 5). This option comes into play if the stock moves below the wave-1 high at $193.80. In that case, Tesla will see a much deeper correction, back to the low $100s once again (red arrow). The first warning of this possibility will be on a close below lower support at $260.

Instead of thinking that this alternate option is only confusing, it provides us with an excellent trading strategy: one can use these price levels as stop losses when entering a long position in the ideal wave-4 target zone. Depending on how aggressive a trader/investor one is, there’s thus a well-defined downside risk and upside reward. No need to use arbitrary 5% or 10% stop losses, which the algos are programmed to sniff out.

While there is still plenty of time and price action left before this stock should ideally bottom for wave-4, I can continue to monitor its progress and use that to my advantage to fine-tune lower and upper price targets as well as stop-loss levels. This is the advantage of the EWP: it helps me to plan the trade and trade the plan. No sweat. I can advise you should do the same.

Latest comments

it would be a trivial ignorance not having included the battery day into the effect on coming wave pattern.
Thanks Doctor, do you have another one for the Nasdaq?  will we go near March lows?
This Company should TRY to improve the Earth's Biosphere. (so sd.)
Too complicated method and no guarantee for being right. IMAO simple bear flag pattern to bring RSI to midrange and next drop could be expected.
Thanks for the great analysis. I just notice if we consider the laternate option, red alt(iii) would be the shortest of the three impulsive, so maybe another reason to stick to the idea we’re in wave 4 and won’t see such low levels. We’ll see.
Hi Doc,what are the chances it's a symmetrical head and shoulders? Your price targets would seem to suggest a probability. If it does do head and shoulders, what are the chances it'll break down from there versus up? thanks
Thanks Dr. Arnout. Unsure if "b" will arrive to 450 or 365, but, anyway, it should close Wave 4 in the end. We'll see!
If the ”a” down to 331, then we might have c=a which could bring us down 100 dollars from where the b tops. What if that takes us down below the ideal 4? Just a question to your excellent follow-up. I hope you’ll continue.
possible, then the alternate option is in play, but I found this Bull has often seen disappointing, failing c-waves, so we'll have to monitor as it goes. i have 0 stack in it, which allows for a more objective analysis :-)
*stake...
Fair enouh :-)
100
Risk Disclosure: Trading in financial instruments and/or cryptocurrencies involves high risks including the risk of losing some, or all, of your investment amount, and may not be suitable for all investors. Prices of cryptocurrencies are extremely volatile and may be affected by external factors such as financial, regulatory or political events. Trading on margin increases the financial risks.
Before deciding to trade in financial instrument or cryptocurrencies you should be fully informed of the risks and costs associated with trading the financial markets, carefully consider your investment objectives, level of experience, and risk appetite, and seek professional advice where needed.
Fusion Media would like to remind you that the data contained in this website is not necessarily real-time nor accurate. The data and prices on the website are not necessarily provided by any market or exchange, but may be provided by market makers, and so prices may not be accurate and may differ from the actual price at any given market, meaning prices are indicative and not appropriate for trading purposes. Fusion Media and any provider of the data contained in this website will not accept liability for any loss or damage as a result of your trading, or your reliance on the information contained within this website.
It is prohibited to use, store, reproduce, display, modify, transmit or distribute the data contained in this website without the explicit prior written permission of Fusion Media and/or the data provider. All intellectual property rights are reserved by the providers and/or the exchange providing the data contained in this website.
Fusion Media may be compensated by the advertisers that appear on the website, based on your interaction with the advertisements or advertisers.
© 2007-2024 - Fusion Media Limited. All Rights Reserved.