Once again, 10-year Treasury yields failed at the top end of a long-term channel, although can push higher near term, creating a trading opportunity in iShares 20+ Year Treasury Bond (NASDAQ:TLT).
Close, but no cigar!
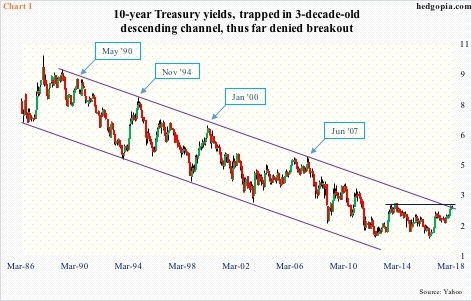
The 10-year rate came very close to breaking out of the three-decade-old descending channel it is in. Yields rose to 2.94 percent on February 21. Depending on how one draws the upper bound of the channel, the 10-year either faintly broke out or kissed the upper end before retreating (Chart 1).
Because it is a declining channel, a breakout will occur sooner or later. Bond vigilantes therefore are probably closely watching three percent. The last time this level was hit was in late 2013/early 2014. Nearly a month ago, another test occurred, and yields (2.85 percent) since have slightly come under pressure.
On both the weekly and monthly charts, there is room for the 10-year to continue lower.
The inability to break out comes amidst signs of growth deceleration.
As of last Friday, the Atlanta Fed’s GDPNow model was forecasting 1Q18 real GDP growth of 1.8 percent. Not too long ago, the model expected growth of north of three percent. This comes on the heels of growth of 2.5 percent in 4Q, 3.2 percent in 3Q17 and 3.1 percent in 2Q17.
Signs of deceleration are evident in several other data points. Take housing.
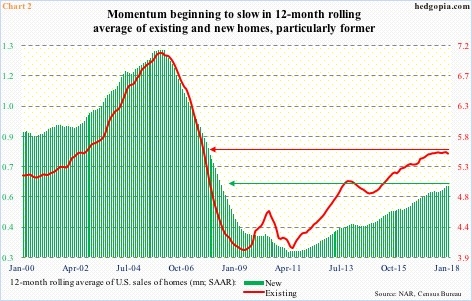
In January, sales of new homes dropped 7.8 percent month-over-month to a seasonally adjusted annual rate of 593,000 units, while that of existing homes fell 3.2 percent to 5.38 million (SAAR). Both reached cycle highs last November – 696,000 and 5.72 million, respectively. They were the highest since October and February 2007, in that order. (February’s numbers come out this week – existing on Friday and new on Wednesday.)
Chart 2 uses this data on a 12-month rolling average basis. The red line already seems to be in a process of rolling over, while the green line was flat in January with December.
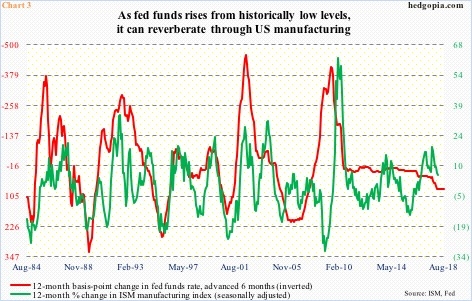
Similar dynamics are in play in Chart 3. It pits year-over-year growth in the ISM manufacturing index with 12-month change in the fed funds rate. The latter is advanced by six months.
The Fed started raising rates in December 2015. The fed funds rate has since gone up by 125 basis points, to a range of 1.25 and 1.5 percent. The FOMC meets this week, and a hike is priced in. By Wednesday, the red line in the chart, which is inverted, would have risen by another 25 basis points, and should continue higher as the year progresses. Historically, the green line tends to move in tandem.
In February, ISM manufacturing rose 1.7 points m/m to 60.8. This was the highest since 61.4 in May 2004. Since the low in August 2016, the index has gone up 10.9 points. Manufacturing activity is very strong, and is likely to at least take a breather. In fact, y/y, the growth rate is already decelerating – from 18.8 percent last August to February’s 5.6 percent.
This is probably what the Treasury yield curve is reflecting.
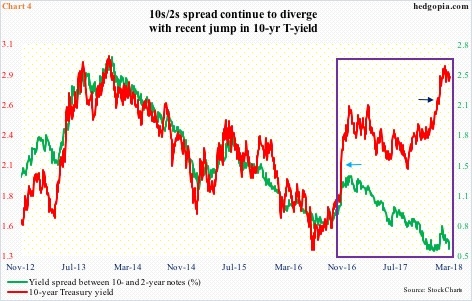
In Chart 4, post-U.S. presidential election in November 2016, there have been two distinct spikes in the 10-year – one right after the election (blue arrow) and the other beginning this year (dark blue arrow). On both occasions, the yield spread between 10- and 2-year notes acted sanguine, to say the least.
On December 21, 2016, the green line peaked at 134 basis points, four sessions after the 10-year made an intraday high of 2.62 percent. This resistance was tested again on March 13, 2017, and by then the spread had narrowed to 122 basis points. When mid-January this year this level got taken out, the spread was in the low-50s. Last Friday, it stood at 54 basis points.
The point is, throughout the recent spike in yields, the 10-year could never match the aggression shown in the shorter end of the curve.
The narrow spread is not in agreement with a scenario in which 10-year yields convincingly break out of the channel, and beyond.
Near-term, however, it is a coin toss. The daily chart is getting oversold, and in the right circumstances, can push higher. A trend line drawn from the February 21 high gets tested around 2.88-2.90 percent.
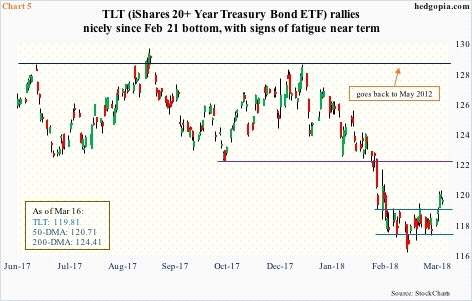
In this scenario, iShares 20+ Year Treasury Bond (NASDAQ:TLT) can head lower. Last Thursday’s high of $120.49 came close to testing the 50-day moving average ($120.71). That was a spinning top session, followed by a doji on Friday. The ETF has had a nice rally since bottoming at $116.51 on February 21, and can give some of it back. Nearest support lies at $119.20, followed by $117.70 (Chart 5). There likely is a trading opportunity here.
A hypothetical buy write (long underlying in combination with short call) was initiated on February 20 with an effective cost of $118.40. This was later followed by a covered call on February 26, which effectively brought the cost down further, to $118.23. Last Friday, the underlying closed at $119.81 – worth locking in $1.58.
Thanks for reading!

