Get 40% Off
🚨 Volatile Markets? Find Hidden Gems for Serious OutperformanceFind Stocks Now

Ten For (You)

Published 06/04/2021, 01:59 AM
Updated 07/09/2023, 06:31 AM

The market isn’t exactly bursting with excitement lately, so let’s take a pleasant stroll through ten up-to-date ETF charts and share a few words about each one. The first, the Dow 30 (DIA), has broken its wedge.
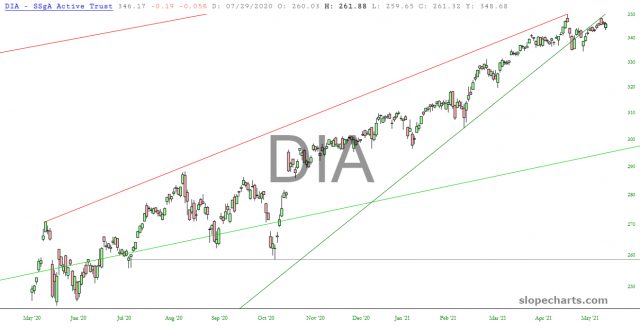
DIA Chart

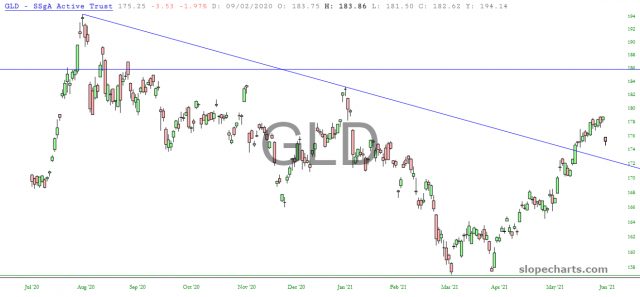
In contrast to this, gold push above its August 6 2020 trendline a couple of weeks ago. On Thursday, however, it gave back about a week’s worth of gains instantly. That trendline represents and important test of support now.
GLD Chart

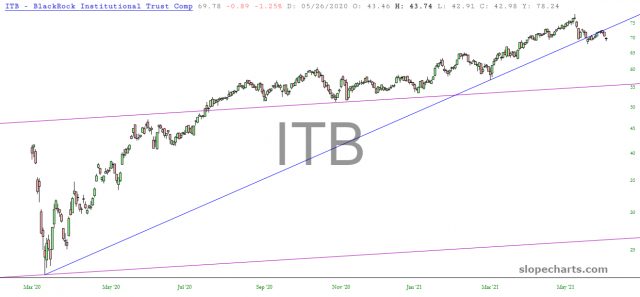
The home construction ETF has also broken its uptrend. Like so many other funds and stocks, the Mar. 23 2020 trendline has been of crucial importance and was unbroken until quite recently.
ITB Chart

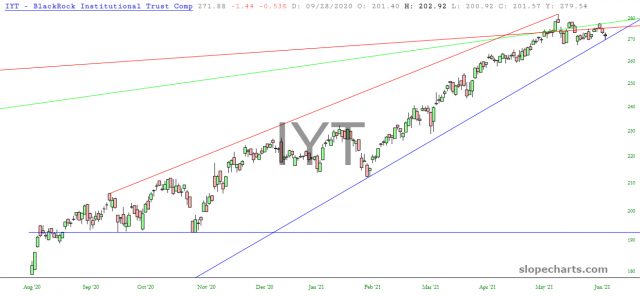
The Dow Transports has not broken its line, which its companion above (DIA) most assuredly has. Thursday’s low precisely touched the supporting trendline.
IYT Chart

Tech stocks have been underperforming relative to SPY for many weeks, and we have been turned away at the red horizontal.
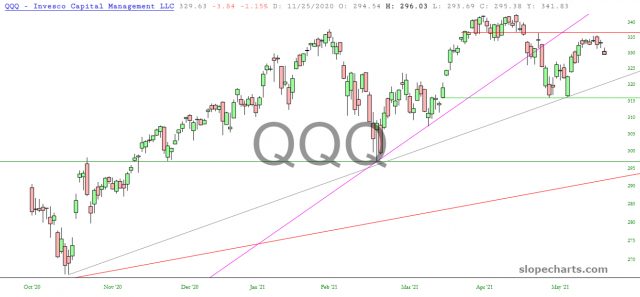
QQQ Chart

Relatedly, the semiconductor index has been meandering for months, trapped in its own sine wave.
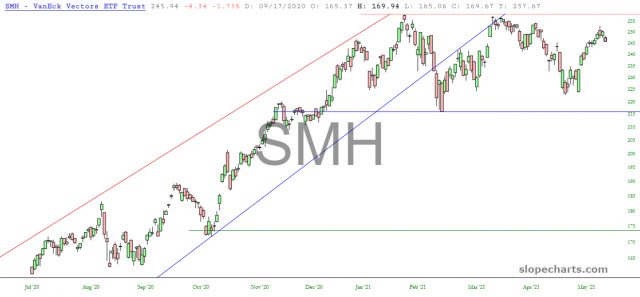
SMH Chart

The granddaddy of them all, the S&P 500 fund, broken its uptrend weeks ago and has been ever-so-slowly creeping higher beneath the underside of the busted wedge.
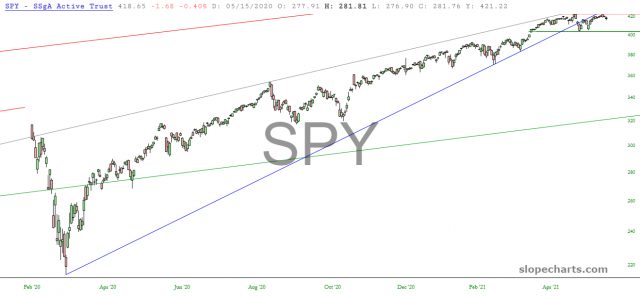
SPY Chart

Another housbuilders ETF has, similar to ITB, failed its uptrend.
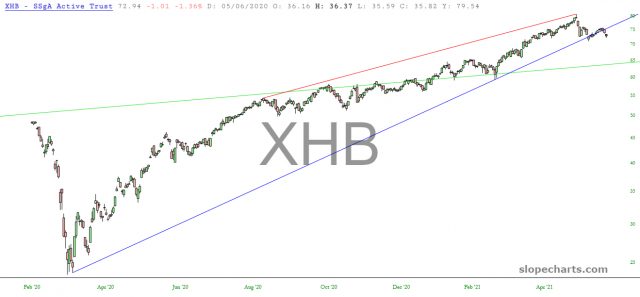
XHB Chart

One of my favorite short ideas these days is the energy sector, and XLE is mushed right up against a long-term broken trendline. I think this is an excellent entry point.
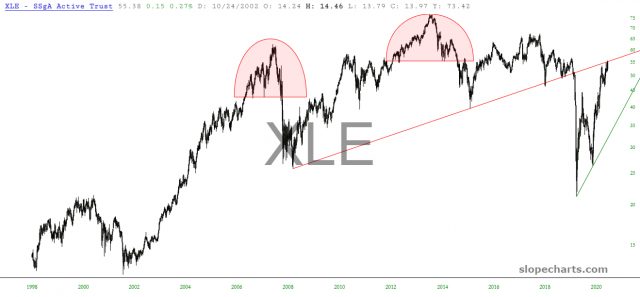
XLE Chart

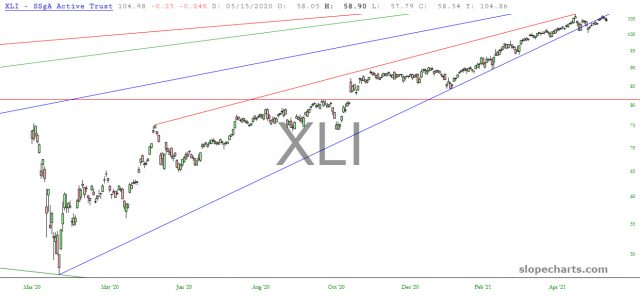
Finally the industrial fund below, similar to the “diamonds”, is just barely beneath its own broken uptrend too.
3rd party Ad. Not an offer or recommendation by Investing.com. See disclosure here or remove ads .
XLI Chart

Latest comments

Risk Disclosure: Trading in financial instruments and/or cryptocurrencies involves high risks including the risk of losing some, or all, of your investment amount, and may not be suitable for all investors. Prices of cryptocurrencies are extremely volatile and may be affected by external factors such as financial, regulatory or political events. Trading on margin increases the financial risks.
Before deciding to trade in financial instrument or cryptocurrencies you should be fully informed of the risks and costs associated with trading the financial markets, carefully consider your investment objectives, level of experience, and risk appetite, and seek professional advice where needed.
Fusion Media would like to remind you that the data contained in this website is not necessarily real-time nor accurate. The data and prices on the website are not necessarily provided by any market or exchange, but may be provided by market makers, and so prices may not be accurate and may differ from the actual price at any given market, meaning prices are indicative and not appropriate for trading purposes. Fusion Media and any provider of the data contained in this website will not accept liability for any loss or damage as a result of your trading, or your reliance on the information contained within this website.
It is prohibited to use, store, reproduce, display, modify, transmit or distribute the data contained in this website without the explicit prior written permission of Fusion Media and/or the data provider. All intellectual property rights are reserved by the providers and/or the exchange providing the data contained in this website.
Fusion Media may be compensated by the advertisers that appear on the website, based on your interaction with the advertisements or advertisers.
© 2007-2024 - Fusion Media Limited. All Rights Reserved.