
TechnipFMC plc (NYSE:FTI) came up with unsatisfactory quarterly results on Feb 20, hit by massive impairment and accounting charges of more than $2 billion, leaving investors disappointed. The oilfield services provider swung to fourth-quarter 2018 adjusted loss of 9 cents a share, lagging the Zacks Consensus Estimate of earnings of 37 cents. This negative earnings surprise of 124.32% was primarily attributed to operating loss of $1.7 billion in the firm’s subsea segment, which missed the Zacks Consensus Estimate of a profit of $92 million. The bottom line also deteriorated sharply from the year-ago earnings of 20 cents a share due to high impairment charges related to goodwill and fixed assets incurred in the quarter under review.
Owing to the dismal quarterly results, TechnipFMC ended 2018 in the red territory, incurring net loss of $1,921.6 million against reported income of $113 million in 2017.
Fourth-quarter revenues came in at $3,323 million, which lagged the Zacks Consensus Estimate of $3,410 million and also decreased 9.8% from the prior-year figure of $3,683 million.
However, on an encouraging note, TechnipFMC’s total backlog at the end of the quarter was $14,560 million, reflecting year-over-year growth of 12%. While quarterly inbound orders marked a decline, full-year orders rose 40.2% from the prior-year quarter to $14,291 million.
TechnipFMC plc Price, Consensus and EPS Surprise
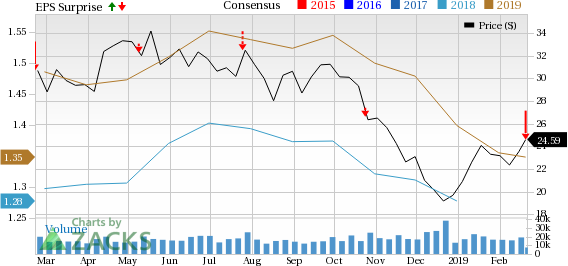
TechnipFMC plc Price, Consensus and EPS Surprise | TechnipFMC plc Quote
Segmental Analysis
Subsea: The segment’s revenues in the quarter under review were $1,233.3 million, reflecting a decrease of 4.6% from the year-ago figure of $1,292.2 million. While the company witnessed increased operations in North and South America, as well as Asia Pacific, completed projects in Africa impacted revenues.
Markedly, the segment was hit by asset impairment charges of $1.775.6 million in the fourth quarter, resulting in operating loss of $1,739.5 million vis a vis reported income of $67.4 million in the year-ago period. Adjusted EBITDAdeclined 39.2% from the year-ago period to $148.5 in the quarter under review amid lower revenues and competitively priced backlog. Notably, vessel utilization rate declined to 62% from 65% in the prior-year period.
Weakness in commodity prices during the fourth quarter resulted in 49% year-over-year decline in the firm’s inbound orders, which came in at $880.6 million. The diminishing inbound orders in turn impacted the segment’s backlog, which totaled $5,999.6 million, reflecting a decline of 3.3% from the year-ago period.
Onshore/Offshore: This segment generated revenues of $1,672.4 million, down 17.2% from the prior-year quarter. The segment’s revenues were negatively impacted by the completion of some key projects, especially Yamal LNG. Operating profit of the segment totaled $206.4 million, down 19.8% from the fourth-quarter 2017 level due to lower revenues and margins. Adjusted EBITDA also fell 26.2% from a year ago to $217.2 million.
However, the segment did offer some respite as its inbound orders jumped 84.1% year over year to $1,609.4 million in the quarter. As such, backlog also increased 27% from the prior-year period to $8,090.5 million.
Surface Technologies: The company’s smallest segment, Surface Technologies, was the only one to record higher year-over year revenues. The unit recorded revenues of $417.3 million, up 12.1% from fourth-quarter 2017 figure of $372.3 million. The increase can be primarily attributed to rising momentum in the North American market as well as higher wellhead product sales. However, unfavorable product mix weighed on the company’s operating profit and adjusted EBITDA, which declined 27.2% and 14.4%y/y to $38.8 million and $64.9 million, respectively.
On an encouraging note, the segment’s inbound orders in the quarter rose 10.7% year over year to $435.1 million. Consequently, backlog increased to $469.9 million in the quarter from the prior-year level of $409.8 million.
Dividend & Stock Buyback
The board of directors declared a quarterly cash dividend of 13 cents per share, payable on Apr 3, 2019 to its shareholders of record at the close of business as of Mar 19, 2019.
During the quarter, TechnipFMC bought back $58.4 million shares, completing the $500-million stock buyback program implemented in October 2017. Bringing in some pleasant news for investors, the firm further boosted its repurchase program by $300 million in December 2018.
Capex & Balance Sheet
In the reported quarter, TechnipFMC spent $112.9 million on capital programs. Full-year capex amounted to $368.1 million.
As of Dec 31, the company had cash and cash equivalents of $5,540 million and a long-term debt of $4,124.3 million, with a debt-to-capitalization ratio of 28.4%.
2019 Capex Cut, Sales and EBITDA Margin View Intact
TechnipFMC slashed its 2019 capex forecast to $350 million from the prior guidance of $400 million.
The company has reiterated its revenue and EBITDA margin forecasts for 2019.TechnipFMC expects subsea, offshore/onshore and surface technologies revenues within $5.4-$5.7 billion, $5.7-$6 billion and $1.7-$1.8 billion, respectively. Revenue forecast of $12.8-$13.5 billion for 2019 versus 2018 sales of $12.5 billion provides a ray of hope. However, respective EBITDA margin guidance of 11%, 12% and 17% for subsea, offshore/onshore and surface technology segments may dent investors’ sentiments.
Final Thoughts
While the company’s acceleration in share buyback, higher y/y revenue forecast and strong backlog raise optimism about this Zacks Rank #3 (Hold) firm, its shareholders are still advised to exercise caution, especially amid low EBITDA margin guidance. As it is, growing volatility in the oil market has forced the company to downwardly revise its capex. Even if the energy landscape rebounds, it is not likely to filter down very soon to oilfield services companies, which are struggling with low margins, utilization rates along with competitively priced backlog amid stiff competition.
Meanwhile, investors interested in the energy space may opt for some better-ranked players in the energy space that include Repsol (MC:REP) SA (OTC:REPYY) , Jones Energy, Inc. (OTC:JONE) and YPF Sociedad Anonima (NYSE:YPF) , each carrying a Zacks Rank #2 (Buy). You can see the complete list of today’s Zacks #1 Rank (Strong Buy) stocks here.
Repsol’s 2019 earnings are expected to increase 13.69% on a year-over-year basis.
Jones’ 2019 earnings are expected to increase 18.95% on a year-over-year basis.
YPF Sociedad delivered average positive earnings surprise of 210.38% in the trailing four quarters.
Today's Best Stocks from Zacks
Would you like to see the updated picks from our best market-beating strategies? From 2017 through 2018, while the S&P 500 gained +15.8%, five of our screens returned +38.0%, +61.3%, +61.6%, +68.1%, and +98.3%.
This outperformance has not just been a recent phenomenon. From 2000 – 2018, while the S&P averaged +4.8% per year, our top strategies averaged up to +56.2% per year.
TechnipFMC plc (FTI): Free Stock Analysis Report
Repsol SA (REPYY): Free Stock Analysis Report
YPF Sociedad Anonima (YPF): Free Stock Analysis Report
Jones Energy, Inc. (JONE): Free Stock Analysis Report
Original post
Zacks Investment Research