As I discussed in last weekend’s missive, the market's breakout to new highs keeps our allocation model nearly fully allocated. However, while we are long, we are still holding onto a little larger-than-normal cash pile, and raised stop levels, to hedge some volatility risk during the summer months. (Stops have now moved up to the bottom of the bullish trendline as shown in the chart below, which coincides with the 100-day moving average that has been a running support line.)
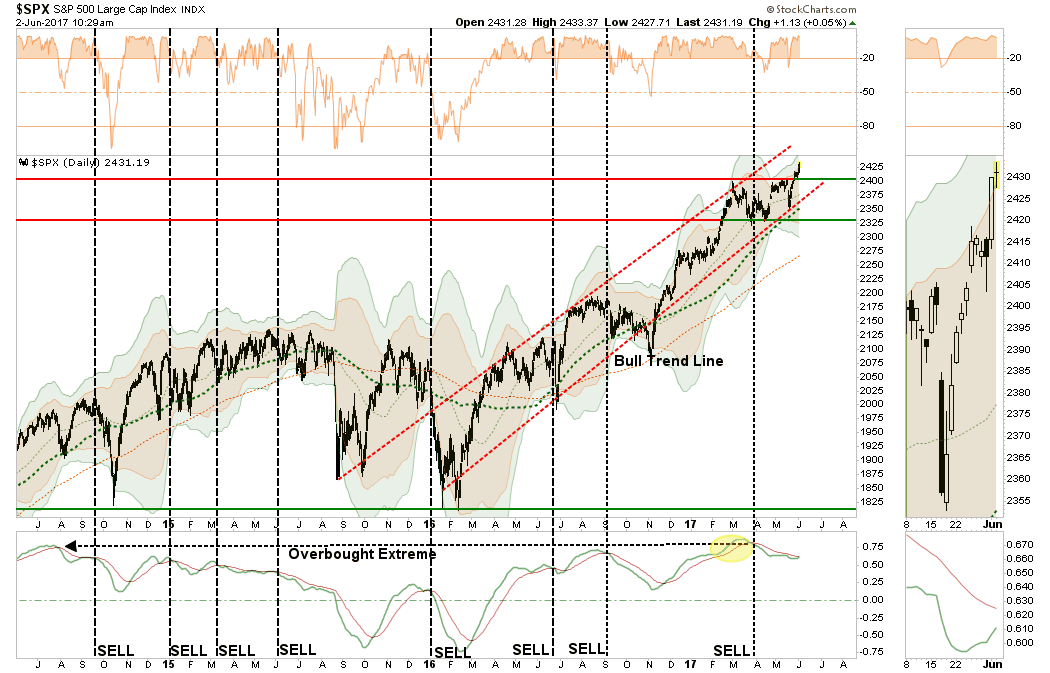
One thing that keeps us a bit more cautious currently is the intermediate term “sell signal,” which remains in place from very high levels. That, as shown below, and with a push into 3 standard deviations above the moving average, has not historically had the best outcomes. So, we’re cautious.
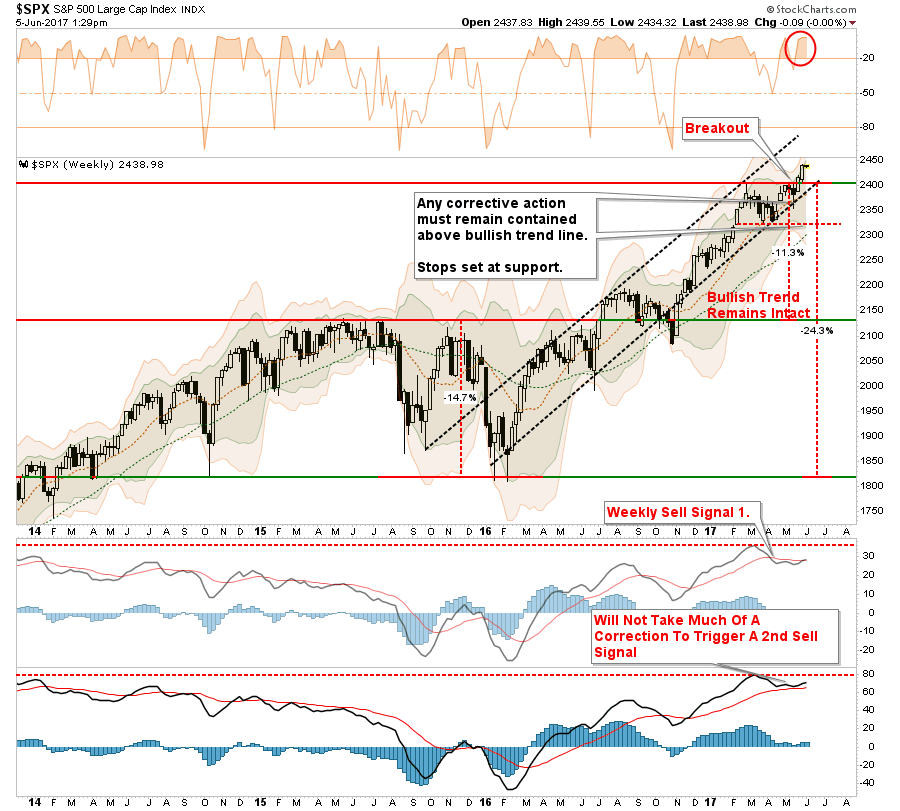
This is a very confusing market and the arguments between the “bulls” and “bears” run deep. It is these emotional biases of being either “bullish” or “bearish,” primarily driven by the media, which keeps you from truly focusing on long-term outcomes. You either worry about the next downturn or are concerned you are missing the rally. Therefore, you wind up making short-term decisions that negate your long-term views.
Understanding this is the case, let’s take a look at the technical case for the markets from both a bullish and bearish perspective. From there you can decide what you do next.
The Bull Case
1) Central Banks Won’t Let The Markets Crash
This is the primary support of the bullish case and is frankly one that is difficult to argue with. Despite all of the hand-wringing over valuations, economics or fundamental underpinnings, stocks have been, and continue to be, elevated due either to “direct” or “verbal” accommodation.
I discussed this idea in The Illusion Of Permanent Liquidity:
But what ongoing liquidity interventions have accomplished, besides driving asset prices higher, is instilling a belief there is little risk in the markets as low interest rates will continue or only be gradually tightened.
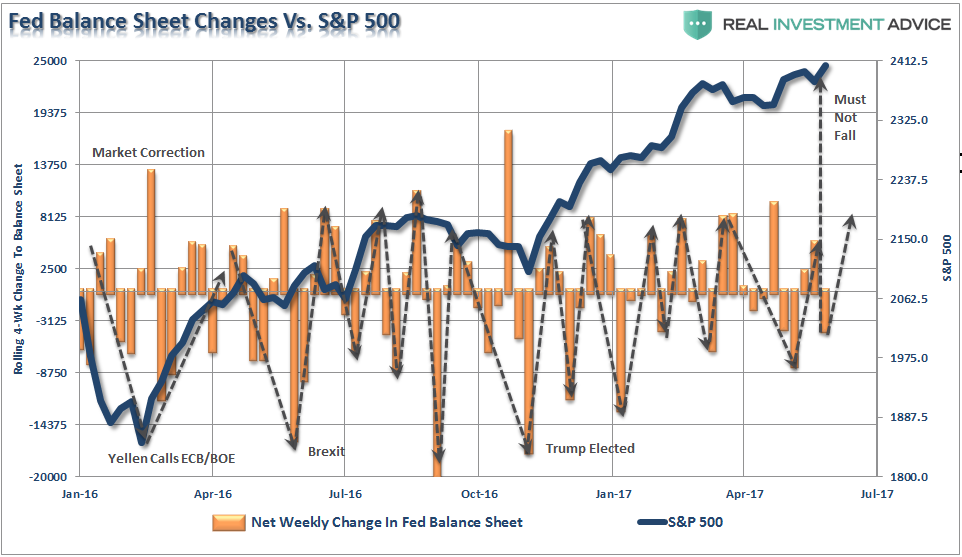
As I showed just recently, while the Fed may not be “actively” engaged in further liquidity injections via “Quantitative Easing,” there is certainly a fairly suspicious pattern as to the timing of the “reinvestment” of the balance sheet.
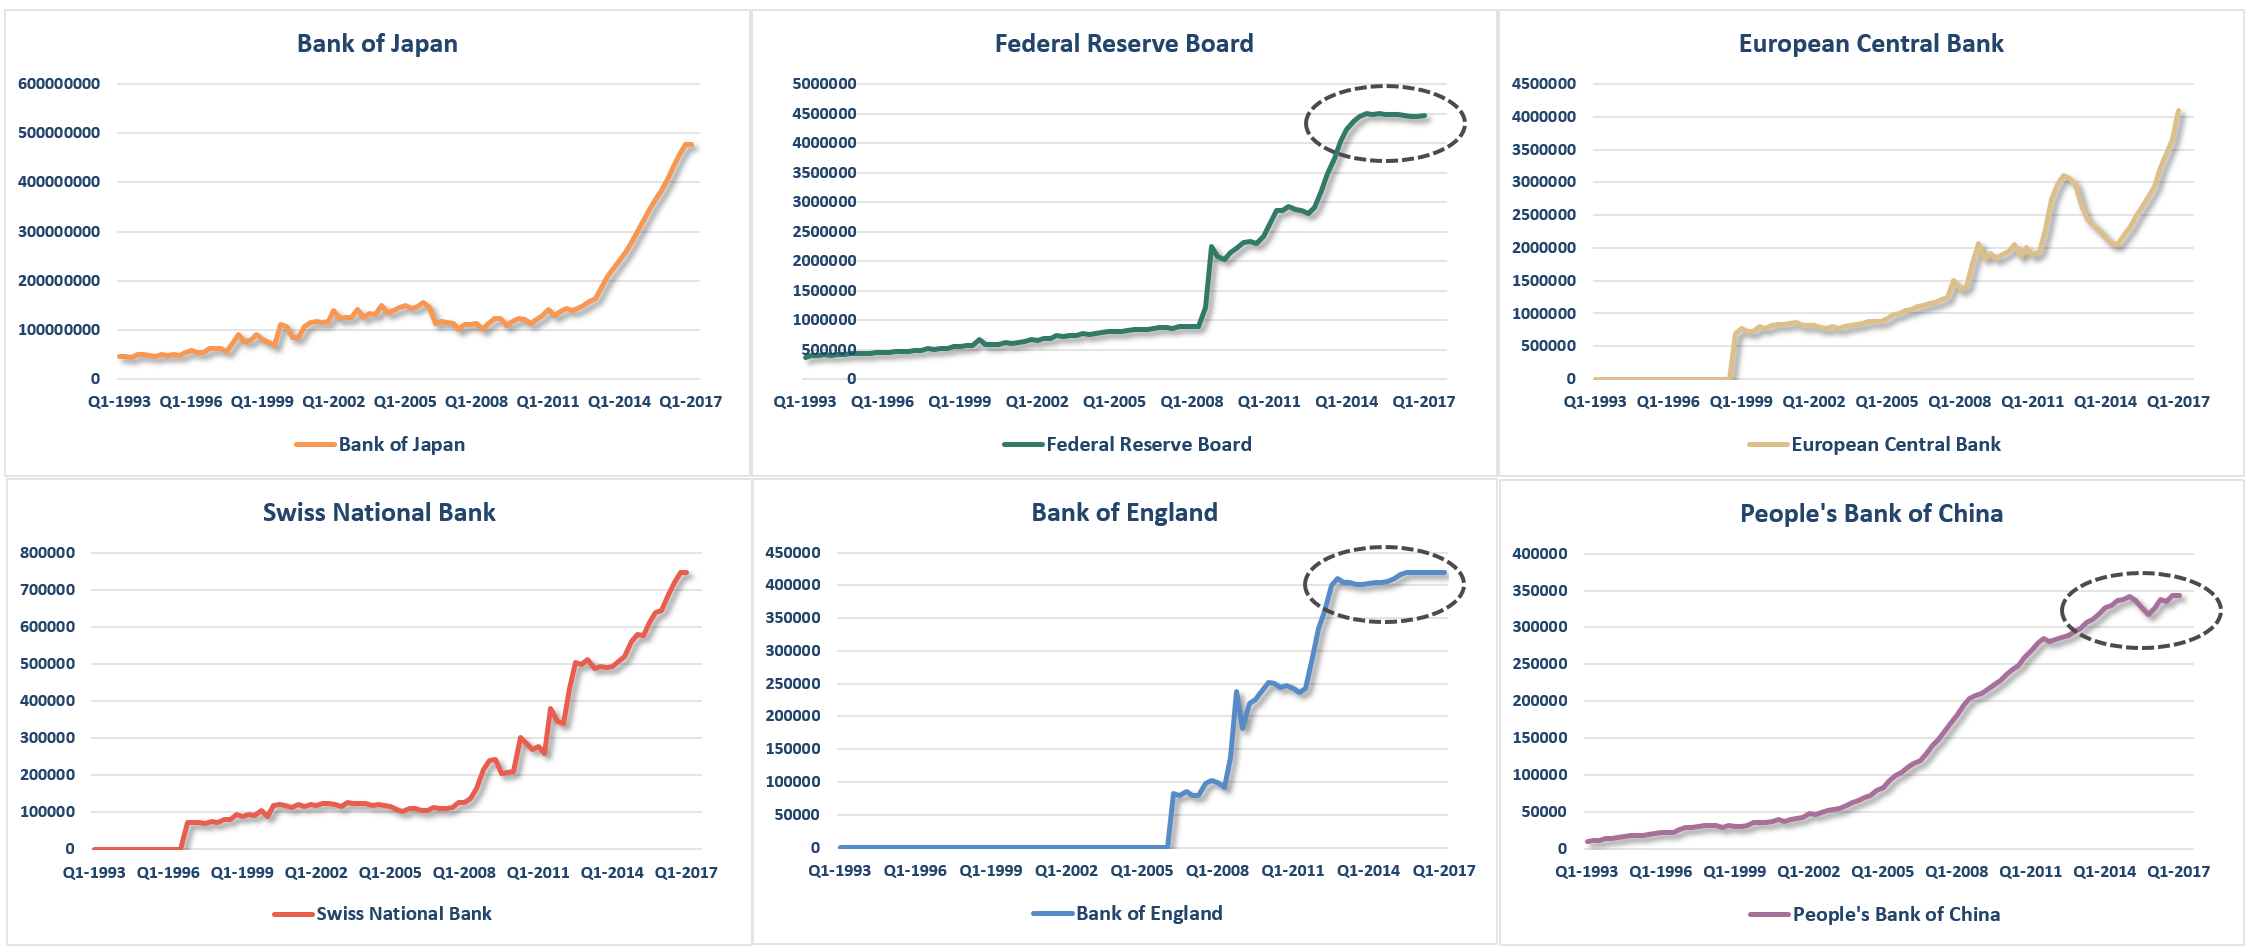
But it isn’t just the Fed that has pushed asset prices higher, but every major central bank globally with almost all of them pushing record levels of assets.
“Bad news is good news” has been the “siren’s song” for the bulls since “low rates for longer” and continued interventions and verbal accommodation keeps the “global chase for yield” intact.
2) Stocks Made A Successful Retest Support & Broke Out
After a good bit of “sideways churning” beginning in March, the market was finally able to muster enough strength to break its 3-month long trading range and move to new highs. While much of the move came from very light volume, the breakout occurred, which is bullish and does suggest higher asset prices in the near term.
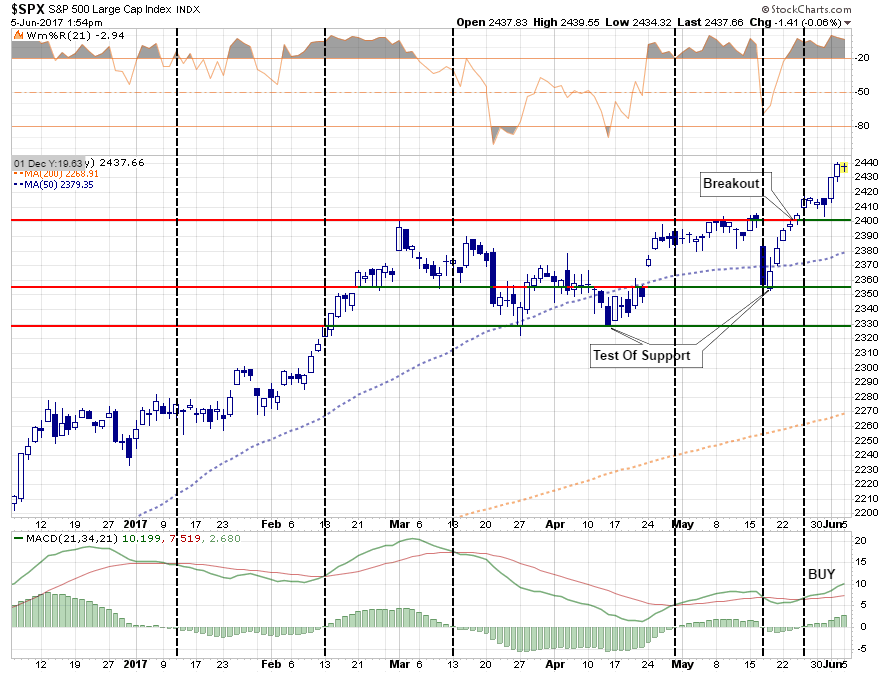
The dashed black lines show the short-term “buy” and “sell” signals with the latest “buy” signal being triggered with the price “breakout” at the end of May.
The market was successfully able to defend crucial support following a sharp selloff on a one-day concern that the current administration “may” have obstructed an investigation. Such was quickly dismissed as #FakeNews by the markets and the markets rapidly regained footing in ongoing anticipation of tax cuts/reforms.
Importantly, the sell signal, which is shown in the lower part of the chart above, was also just as quickly reversed removing downward pressure on the market in the short term. While the markets remain extremely overbought in the short term, and some corrective action is likely, any such correction that does not violate the recent “breakout” and/or critical support levels, will keep the current bull-market advance intact.
3) Advance-Decline Line Is Improving
The participation by stocks in the recent bullish advance has been strong enough to push the advance-decline line back onto a short-term “buy signal” as well.
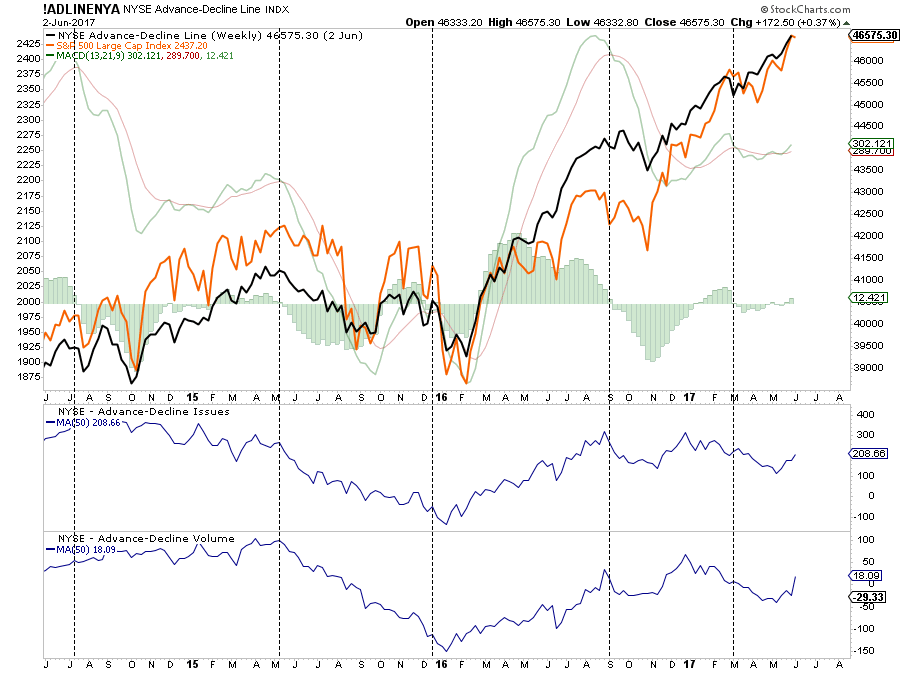
After languishing since the beginning of the year, both the number and volume of stocks on the NYSE are now participating in the advance. The rise in participation supports the bullish momentum behind stocks and should not be dismissed.
As shown above, the short-term dynamics of the market remain bullishly biased. This suggests that equity exposure in portfolios remains warranted for the time being. However, let me be clear, this is VERY SHORT-TERM analysis. From a TRADING perspective, we remain in a bull market. This DOES NOT mean the markets are about to begin the next great secular bull market. Caution is highly advised if you have an inherent disposition to “hoping things will get back to even” if things go wrong, rather than selling.
The Bear Case
The bear case is more grounded in longer-term price dynamics – weekly and monthly versus daily, which suggests the current rally remains a reflexive rally within the confines of a more bearish backdrop.
1) Bonds Ain’t Buyin’ It
As I noted this past weekend:
The biggest problem I have currently is simply that bonds are NOT buying the rally. As I discussed last week, and as we saw on Friday, bonds continue their ‘bullish bias’ and broke through key support levels suggesting lower rates to come.
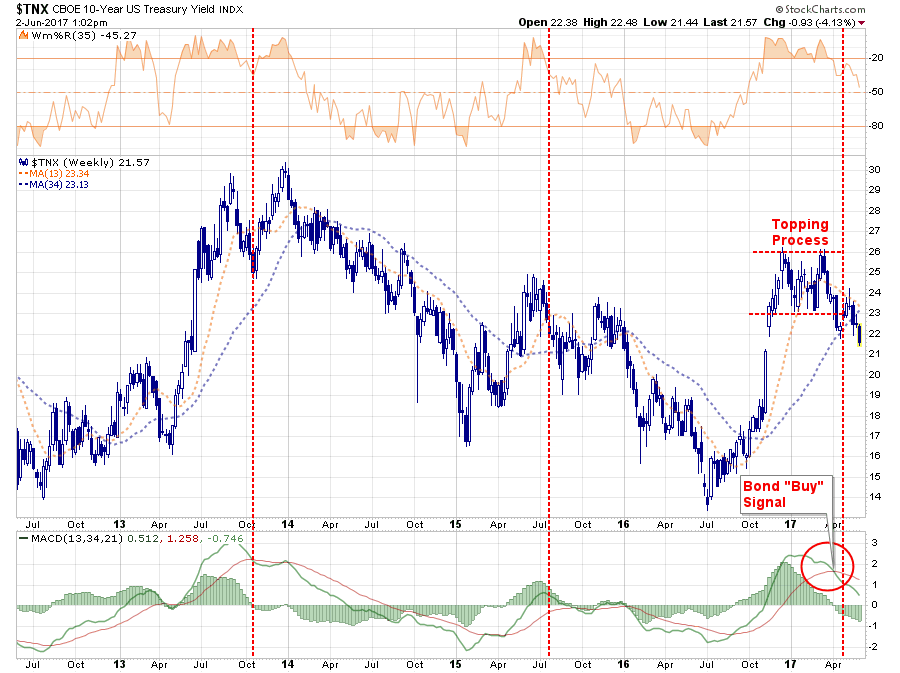
With interest rates still overbought, and on an important sell signal, the downside break from the recent consolidation process suggests lower rates/higher bond prices in the near term.
On a longer-term basis, this suggests that either bonds (risk-off) or stocks (risk-on) is wrong. My suspicion is that ultimately stocks will take the hit as the credit market, which analyzes actual balance-sheet risk, tends to be right more often than not.
2) Longer-Term Dynamics Still Bearish
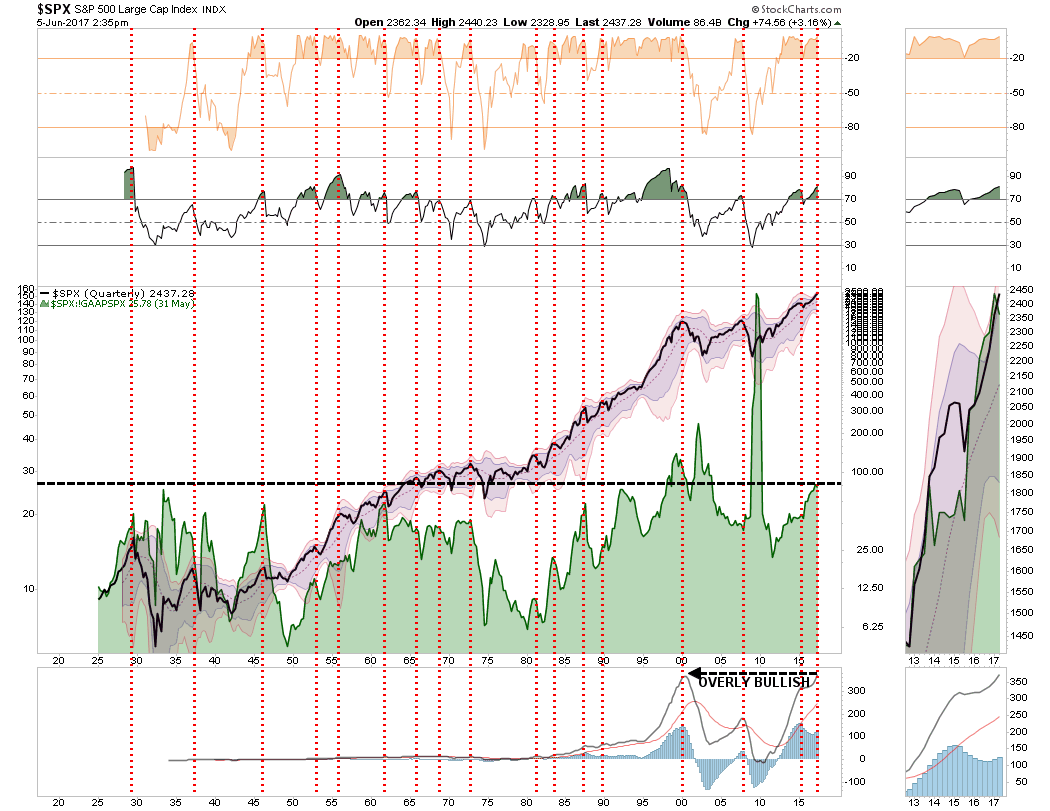
If we step back and look at the market from a longer-term perspective, where true price trends are revealed, we see a very different picture emerge. As shown below, the current dynamics of the market are extremely similar to every previous bull-market peak in history. Given the deterioration in revenues, valuations, corporate profits and weak economics, the backdrop between today and the end of previous bull markets remains consistent.
3) M&A Ain’t “M’n or A’n”
A recent post via Business Insider brought to light an interesting view to a longer-term driver of market support.
M&A lawyers argue the ‘uncertainty’ factor, which has come about recently, given some unpredictable aspects of the new Trump administration, has been the issue. It only may explain the last six months, but the trend has been poor for about two years or more. In the past, there has been some correlation with the S&P 500 and thus it could generate more legitimate fears than some of the other excuses that are put forth for not wanting to buy American equities.
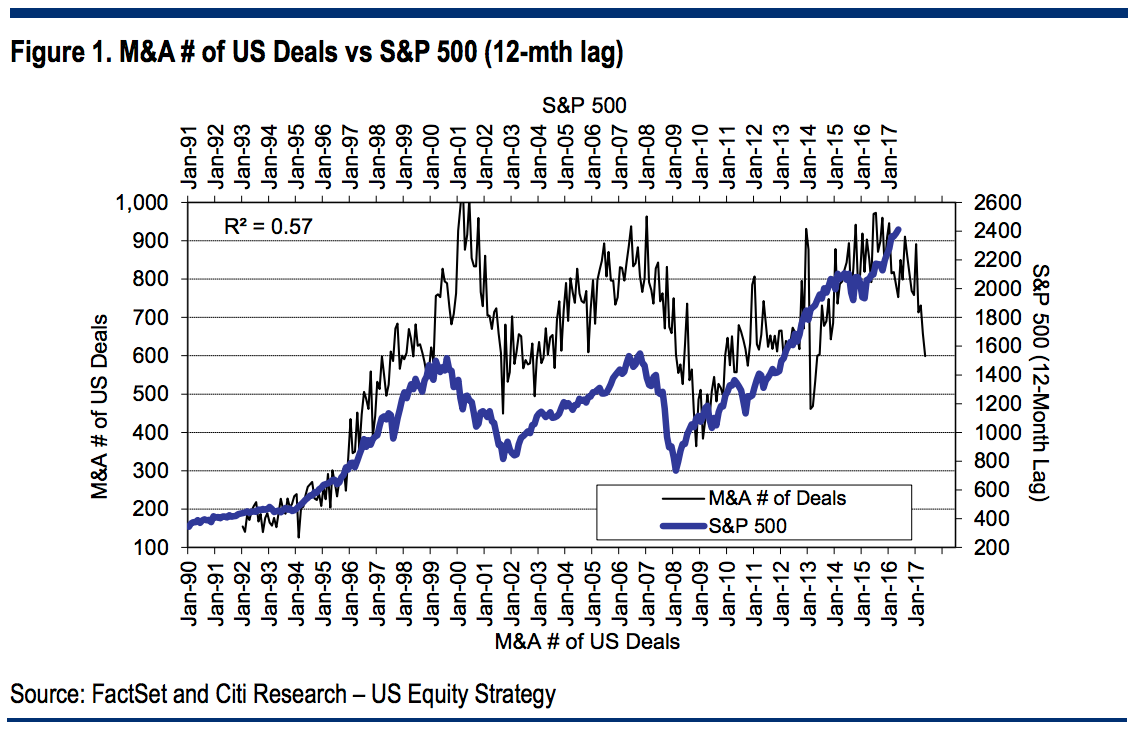
This year through June 5, 7,561 deals were announced, the lowest count since 2013, according to S&P Global Market Intelligence. While M&A volume reached a record $2.055 trillion 2013, the volume has slipped in 2016 to just $1.7 trillion.
Given the length and maturity of the current economic expansion, tighter monetary policy in the U.S. and a lack of legislative agenda moving forward in Washington, there is further risk of M&A support being pulled from the markets.
What you decide to do with this information is entirely up to you. As I stated, I do think there is enough of a bullish case remaining to warrant some equity risk on a very short-term basis.
However, the longer-term dynamics are clearly bearish. When those negative price dynamics are combined with the fundamental and economic backdrop, the risk of having excessive exposure to the markets greatly outweighs the potential reward.
Could the markets rocket up to 2500 or more as some analysts expect? It's possible given the ongoing interventions by global central banks, bullish optimism and the rising belief that “this time is different.”
The reality, of course, is that while the markets could reward you with 100 points of upside, there is a risk of 600 points of downside just to retest the lows of 2016.
Those are odds that Las Vegas would just love to give you.
