Technically Speaking September 30 - October 4
Summary
- International data points to a slowdown in global manufacturing.
- US data is a tad weaker, but still indicative of a growing economy.
- The markets have returned to a defensive posture.
International Economic Data
UK/EU Data
UK
- 2Q GDP rose 0.2% Q/Q; 1.3% Y/Y
- Service PMI 50.6-49.5
- Manufacturing PMI 47.4-48.3
EU
- Retail sales increased 0.3% M/M; 2.1% Y/Y
- CPI at 0.9% annual rate
- EU unemployment rate at 7.4%
- EU manufacturing PMI 47-45.7%
- EU Services PMI 53.2-53.5
UK/EU Conclusion: The specter of Brexit is clearly hurting the UK's economy. Manufacturing continues to contract while services declined for the first time in a number of years. GDP growth is weak. The EU's manufacturing sector is contracting due to increased international trade conflict. Services remain a bright spot. The unemployment rate is still high, but that's due to three of the largest economies (Italy, France, and Spain) all having unemployment rates above the average. The unemployment rate's trend remains lower.Japan/Australia
Japan
- Manufacturing PMI 49.3-48.9
- Services PMI 53.3-52.9
- Unemployment 2.2%
Australia
- AIG Manufacturing 53.1-54.7
- AIG Services 51.4-.51.5
- Retail sales +0.4%
Japan/Australia Conclusion: As with other regions, Japan's economy is split, with manufacturing suffering from the decrease in global trade while the services sector continues to expand. Further confounding the Bank of Japan's policy options is the low unemployment/declining inflation scenario. Australia stands in contrast as both economic sectors are increasing -- the manufacturing sector in a strong manner. And despite a high level of household indebtedness, households are still spending.
Canada
- GDP unchanged in July; up 0.8% on a rolling, 3-month basis
Central Banks Actions of Note
Australia lowered rates 25 basis points to 0.75%. The bank's statement makes a number of key observations (emphasis added):
While the outlook for the global economy remains reasonable, the risks are tilted to the downside. The US–China trade and technology disputes are affecting international trade flows and investment as businesses scale back spending plans because of the increased uncertainty. At the same time, in most advanced economies, unemployment rates are low and wages growth has picked up, although inflation remains low. In China, the authorities have taken further steps to support the economy, while continuing to address risks in the financial system.
The emphasized sentences encapsulate the two key issues facing the global economy. Internationally, trade is down due to the U.S.-China trade conflict. Domestically, a number of countries (Japan and the US are the biggest stand-outs) have low unemployment and low inflation, which greatly complicates each central bank's job.
The RBA described the Australian economy thusly:
The Australian economy expanded by 1.4 per cent over the year to the June quarter, which was a weaker-than-expected outcome. A gentle turning point, however, appears to have been reached with economic growth a little higher over the first half of this year than over the second half of 2018. The low level of interest rates, recent tax cuts, ongoing spending on infrastructure, signs of stabilisation in some established housing markets and a brighter outlook for the resources sector should all support growth. The main domestic uncertainty continues to be the outlook for consumption, with the sustained period of only modest increases in household disposable income continuing to weigh on consumer spending.
The cut was a bit of a surprise. But two facts support the bank's decision. The first is that other banks are lowering rates or are expected to. Because Australia is an export-dependent economy, their rates need to be on par with other countries to keep the Australian dollar's value in check. Second, the RBA believes the economy is at a "gentle turning point." The rate cut could simply be the bank's way of further stimulating upside growth.
The Bank of India lowered rates by 25 basis points (emphasis added):
Taking into consideration all available information and analyses, the MPC voted unanimously to reduce the policy repo rate, with five members voting to reduce the policy rate by 25 basis points. The MPC also decided to continue with the accommodative stance as long as it is necessary to revive growth, while ensuring that inflation remains within the target.
The bank cited a now-familiar fact pattern: weaker global trade conditions and a slowdown in domestic manufacturing:
Among advanced economies (AES), the slowdown in the second quarter of calendar 2019 appears to have extended into the third quarter as well. For emerging market economies (EMES), the worsening global economic and trade environment is weighing upon their macroeconomic performance.
...
Industrial production was lower in July 2019 on a year-on-year basis, pulled down mainly by manufacturing. The production of capital goods and consumer durables contracted. The output of eight core industries contracted in August, with the production of coal, electricity, crude oil and cement decelerating or going into contraction. The manufacturing PMI for September 2019 was flat, though still in the expansion zone. High frequency indicators suggest that services sector activity weakened in July-August.
India, like China, could be approaching an economic inflection point, where the economy starts to make the transition from an emerging to an advanced economy, which means a natural slowdown in GDP growth is inevitable.
Key US Economic Data
The ISM non-manufacturing index fell 3.8 points to 52.6. The news seemed to make more of this drop than warranted. Production and new orders indexes are still at strong levels (55.2 and 53.7, respectively). The employment index is right above 50 (current reading: 50.4); however, and therefore bears watching.
Manufacturing is a different story: the headline number fell further dropping 1.3 points to 47.8. New orders, production, and employment are all below 50 (indicating contraction) for a second month. The anecdotal comments are broadly negative (emphasis added):
This is a very concerning development; until the last few months, the US economy appeared to be insulated from the global manufacturing slowdown. That may no longer be the case.
On Friday, the BLS released the latest employment report which had a headline job gain of 136,000. I prefer to use the 3, 6, and 12-month moving average of establishment job gains to eliminate the monthly noise:
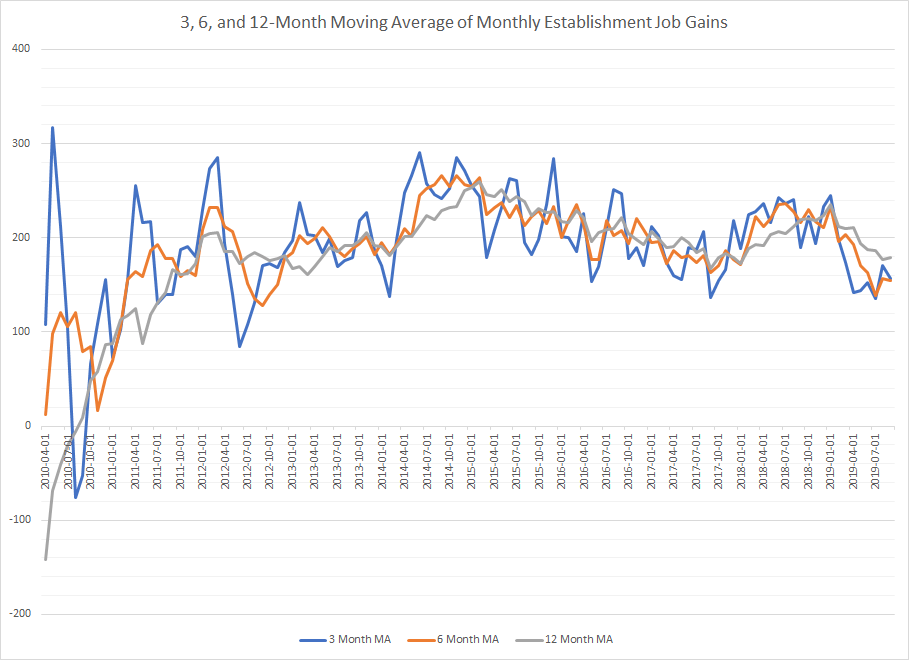
It appears that the 3 and 6-month moving average are starting to coalesce around the 150,000/month level. This is a very understandable development as the expansion is now in its 10th year.
US data conclusion: the second consecutive month of manufacturing contraction is concerning, especially as the anecdotal comments indicate a broad slowdown appears to be underway. Manufacturing is a less important part of the US economy, so the drop in activity probably won't be enough to cause a recession. But it will certainly slow GDP growth. The service sector is still expanding, but the barely positive reading in the employment sub-index should be monitored. It's surprising that the pace of job growth hasn't slowed down until now, given the length of the expansion. Overall, the data still points towards an economy that is expanding modestly.
US Markets Overview
Let's look at this week's performance table:
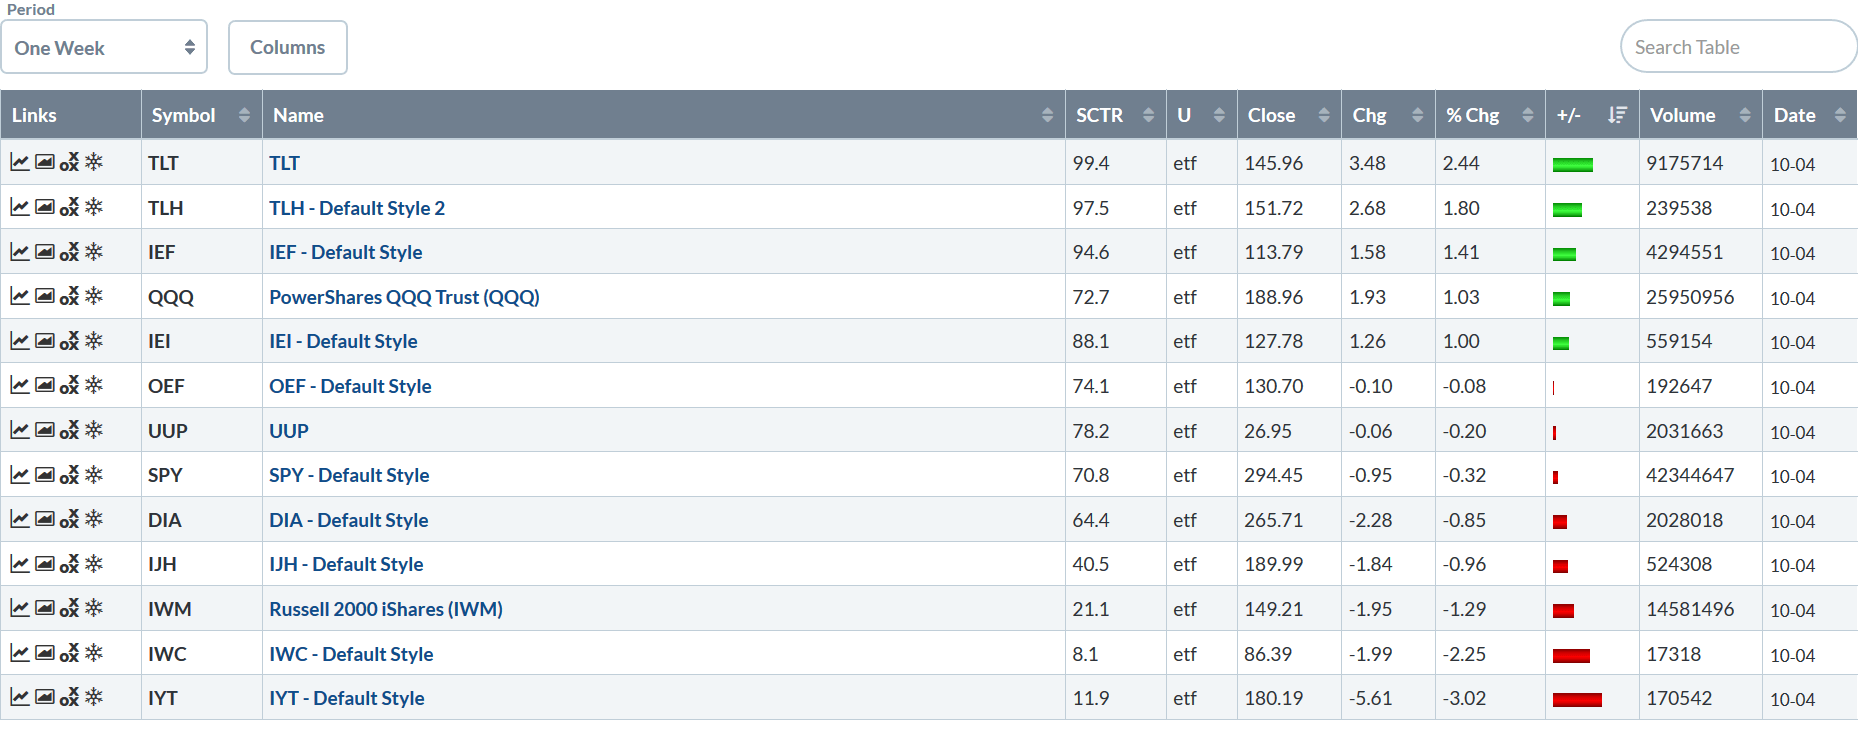
Once again, the Treasury market rallied strongly, with the long end of the curve rallying about 2.5%; the 10-20 year section of the curve was up 1.8%. The QQQ gained 1%, but that was the only equity market that moved higher. The SPY was off modestly; the DIA dropped 0.85%. The smaller the index composition, the bigger the loss. This is a very defensive alignment for the markets, indicating that traders are concerned about the economy.
Let's look at three different indexes -- the IEF, IWM, and SPY -- in three different time frames -- the 5-day, 30-day, and daily.
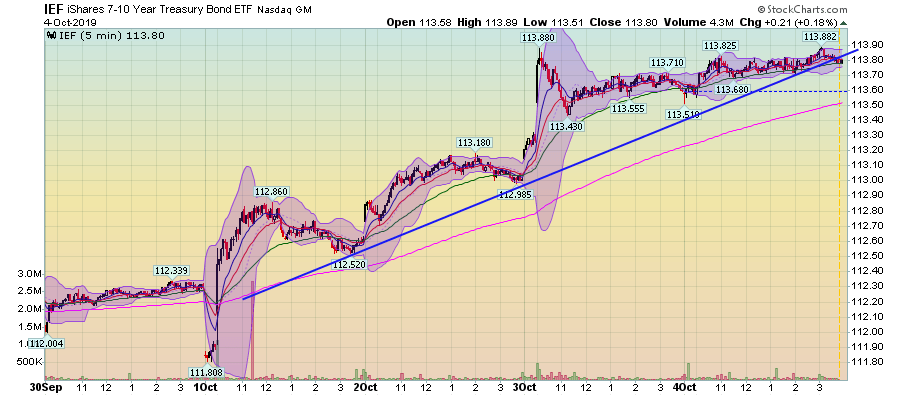
This week, the Treasury market caught a strong bid. The index was up modestly on Monday. Between Tuesday and Friday the index's pace of pick-up increased.
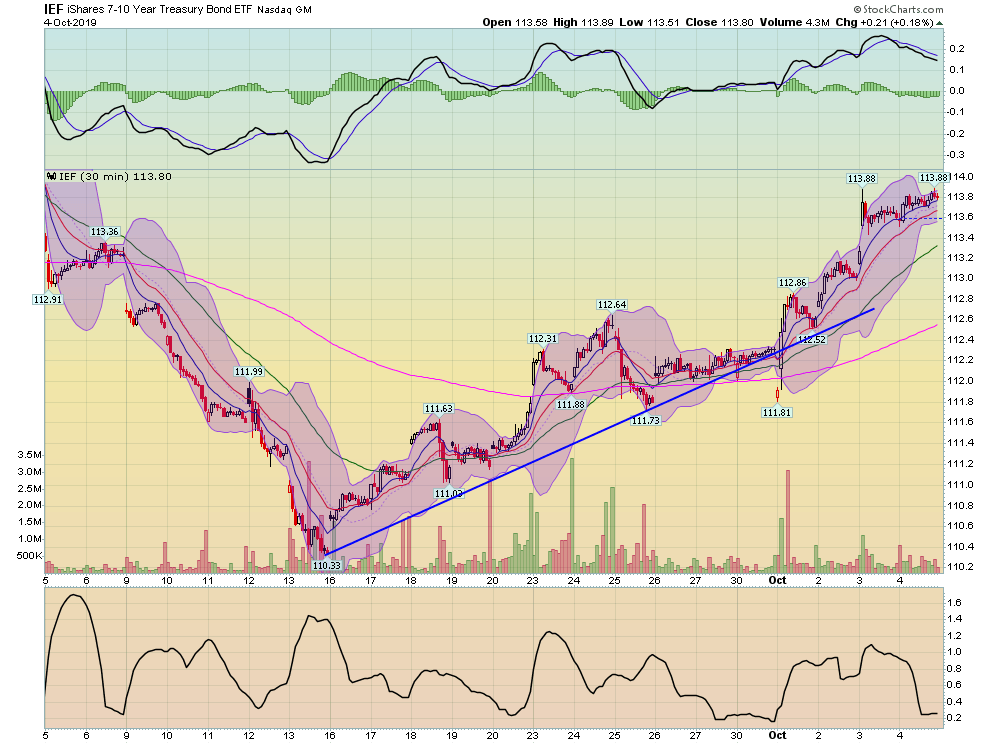
The IEF is now near its highest point in the last 30 days. The IEF dropped sharply at the beginning of the month as the stock market -- especially small-caps -- rallied (more below). But starting mid-month, the IEF started to gain and has been rallying since.
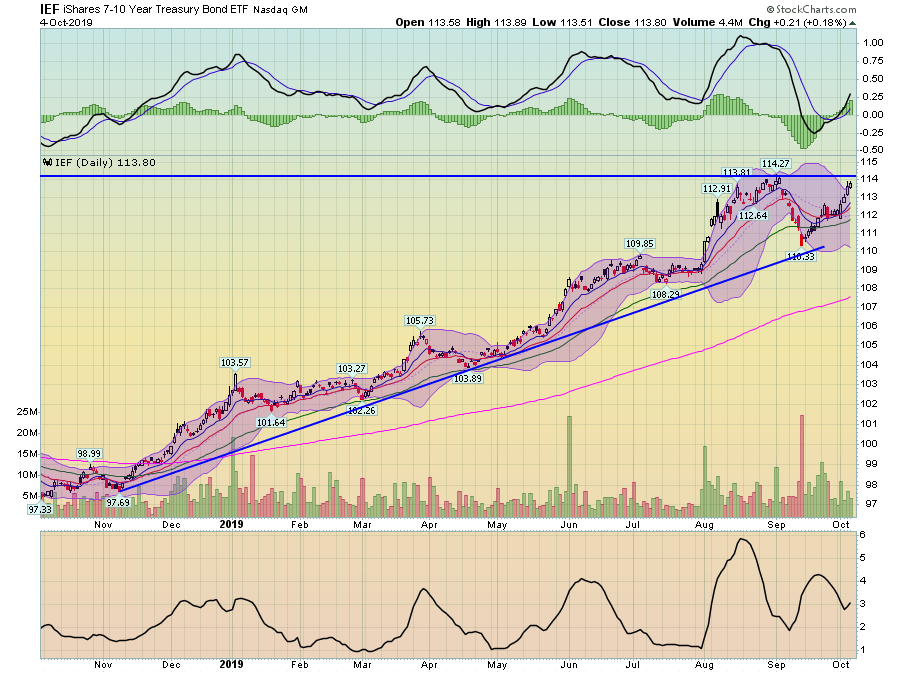
On the daily chart, the IEF is once again approaching yearly highs.
The IWM is again starting to languish:
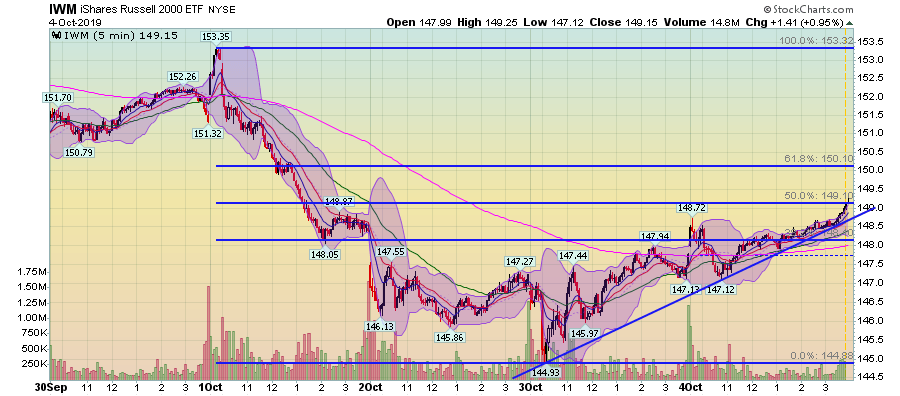
The IWM sold off at the beginning of the week. It's made a modest comeback. However, it only barely touched the 50% Fib level.
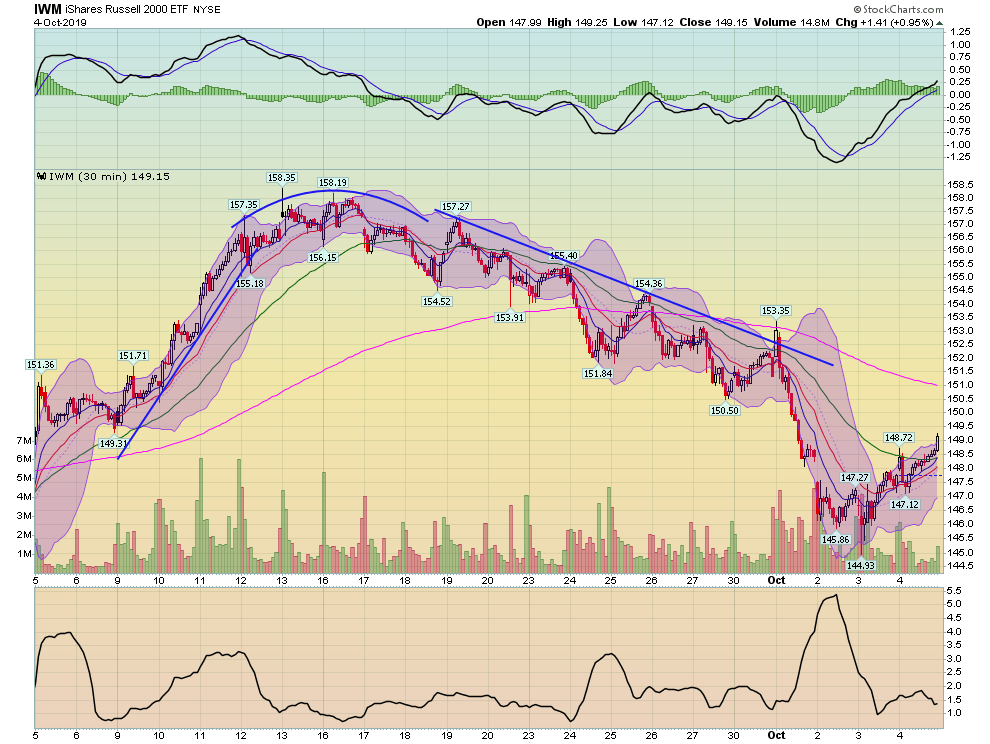
The 30-day IWM chart shows that prices have been moving consistently lower since the rally at the beginning of the month.
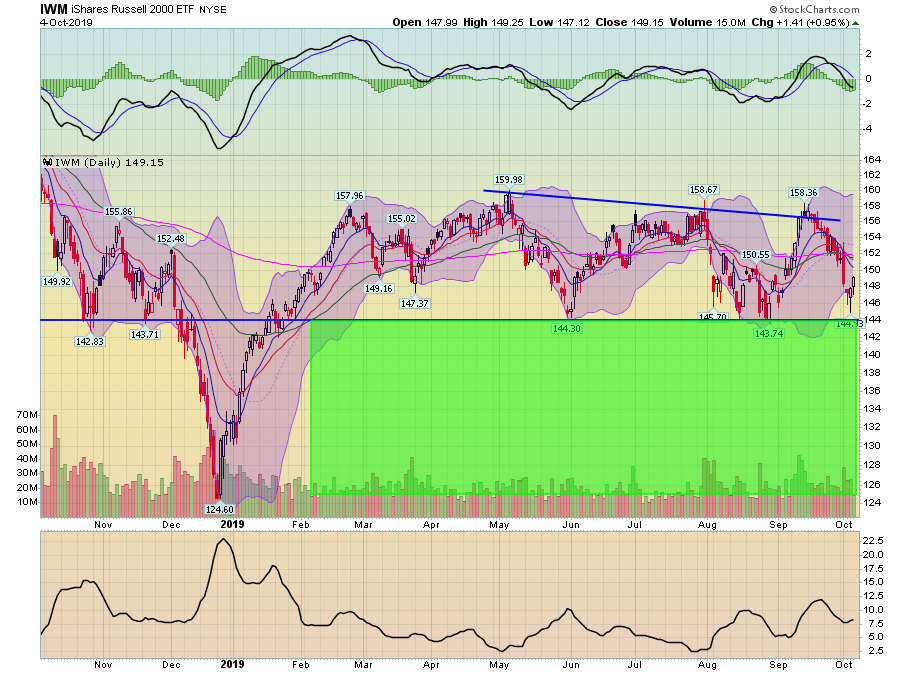
On the daily chart, the IWM is again approaching key technical support levels.
Finally, let's turn to the SPY:
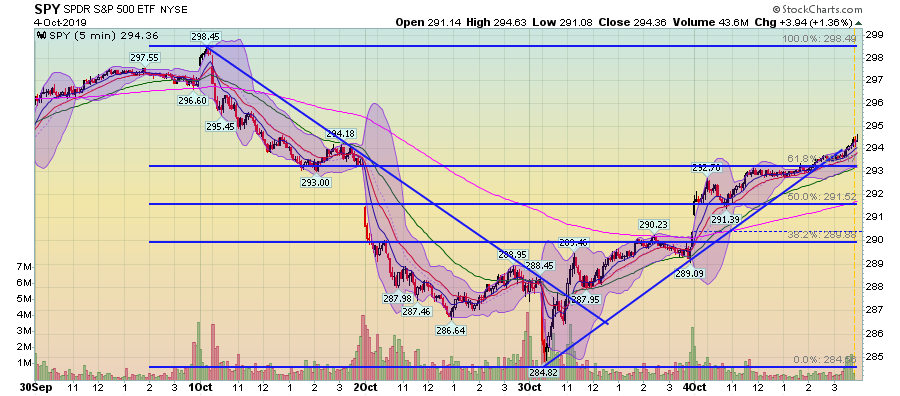
Like the IWM, it sold off at the beginning of the week. But its counter-rally is much stronger than the IWMs.
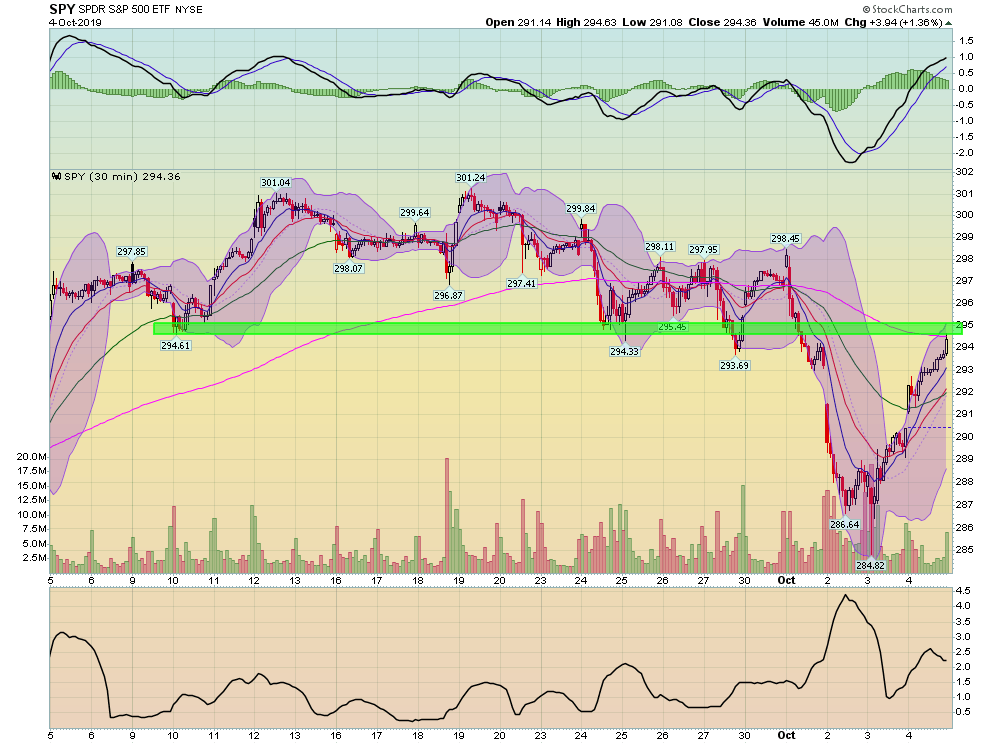
The SPY has rebounded to key technical support levels on the 30-day chart.
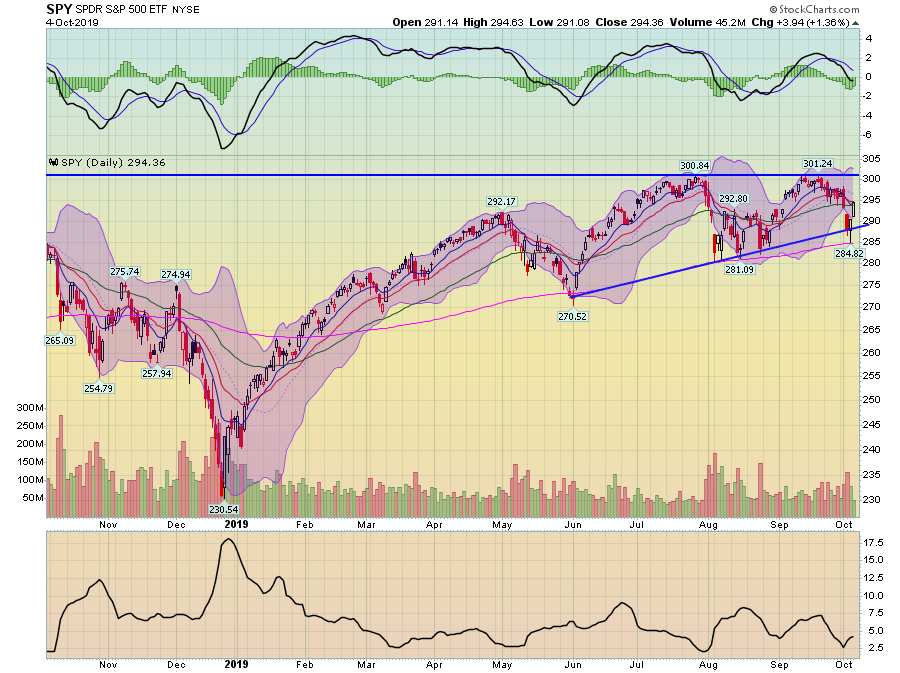
Finally, the SPY continues to consolidate is a rising wedge pattern.
Ultimately, the market has returned to a defensive posture: the Treasury market is rallying, large-caps have a modest bid and smaller-caps are languishing. It indicates that traders are again concerned about the strength of the underlying economy.
