S&P 500: CTA buying halts at 6,925; selling accelerates below 6,500, UBS says

Summary
Trade war tensions continue to escalate.
Commodity prices have dropped sharply.
The markets are in good technical shape.
The trade war drama goes on ... and on ... and on. The big news this week was the potential levying of an additional $200 billion in tariffs on Chinese goods. Some reports indicated that the administration was considering levying tariffs on all Chinese imports, which would total $500 billion. We're already starting to see news that companies are shifting operations as a result of the tariffs. Harley-Davidson Inc (NYSE:HOG) was the first; BMW (OTC:BMWYY) followed mid-week. According to the NY Times, the average cost of the tariffs is (so far) a very small $60/person. But expect that number to eventually start rising.
The trade war is having an unexpected side-effect: commodity prices are dropping sharply:

Above is a three-month performance chart of ETFs that track grains, industrial metals, precious metals, copper and soft agricultural products. The best performer is the precious metals ETF; it's only down 7%. Grains were the hardest hit; they're off almost 18%. The good news here is this will help to contain inflationary pressure, which, according to the latest CPI report, was 2.9% overall and 2.3% core.
And speaking of commodity prices, oil prices took a big hit mid-week thanks to news that Libya was ramping up production:

Oil prices are still far below levels that were a partial cause of the 2007-2009 recession. But the decline is still beneficial.
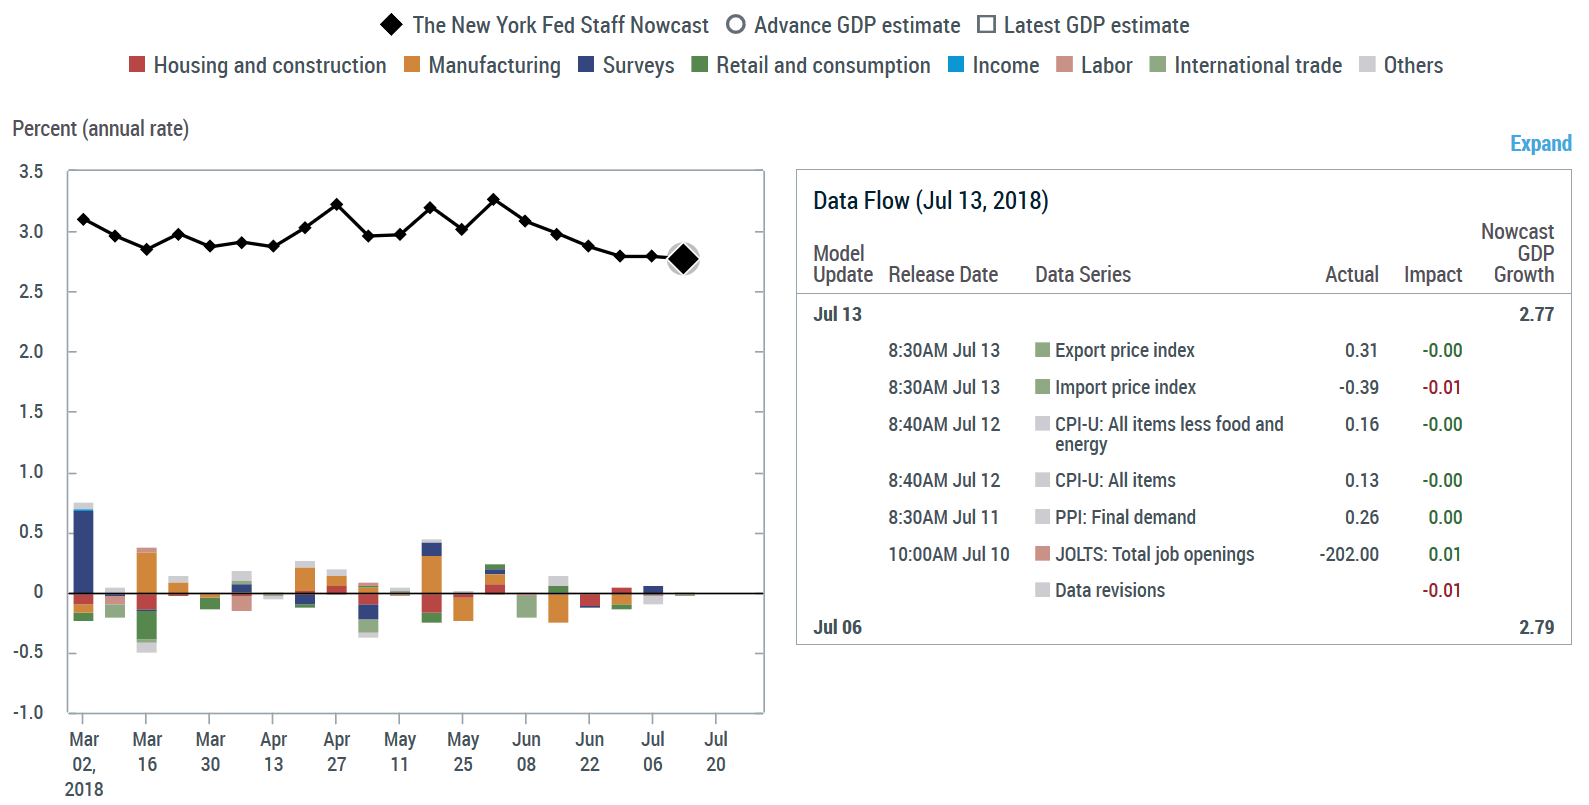
Turning to the market backdrop (GDP and earnings), we have a mixed prediction for 2Q GDP. The NY Fed's "Nowcast" is at 2.77%:
While the Atlanta Fed's is 3.9%.

And the second-quarter earnings season is looking strong:
Total Q2 earnings for the S&P 500 index are expected to be up +19.1% from the same period last year on +8.2% higher revenues, with double-digit earnings growth for 11 of the 16 Zacks sectors, including Finance and Technology. This would be the 3rd quarter in a row of double-digit earnings growth for the index, a trend that is currently expected to continue in the second half of the year as well.
Next up, let's look at the indexes' overall performance:

Overall, this was a good week. With the exception of the Russell 2000, all the indexes were up. The Dow and NASDAQ advanced slightly over 2%, while the SPY increased about 1.5%. The Treasury market was stable.
The three primary daily charts are all positive:

The QQQ has the best chart. It is in the middle of a rally that connects the lows of early April, late April, and late June. All the EMAs are advancing and prices are using the shorter EMAs for technical support. The MACD recently gave a buy signal and prices are at a one-year high.

The SPYs are also in the middle of a three-four month rally. Prices have broken through resistance in the upper 270s and are now targeting the highs established right after the first of the year.

The IWM have fallen back after attempting to hit a new high in the upper 160s.
Overall, the technical side of things is positive. EMAs are advancing and momentum is rising. Combine that with the potential support of a strong earnings season, and we could see this rally continue into the summer.
Disclosure: I/we have no positions in any stocks mentioned, and no plans to initiate any positions within the next 72 hours.
I wrote this article myself, and it expresses my own opinions. I am not receiving compensation for it (other than from Seeking Alpha). I have no business relationship with any company whose stock is mentioned in this article.