
Summary
- The budget impasse will hurt growth; it's not a matter of if but by how much
- Consumer sentiment took a big hit in the latest report
- The markets are doing very well
Yes, the budget impasse will hurt growth: There are two generally-accepted models of the macroeconomy: aggregate demand/aggregate supply (AD/AS) and the investment-savings/liquidity money supply (IS/LM). Both models contain all the elements of GDP: the AD and IS line can be thought of as consumer spending (PCE) + investment (I) + net exports (X) + government spending (G). The shutdown lowers (PCE) and (G) and will eventually start lowering (I). This shifts the AD and IS curves to the left, lowering growth.
And we have this from the NY Fed (from my Twitter feed):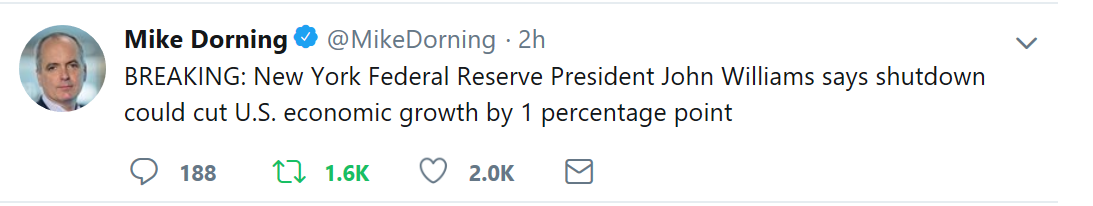
Consumer sentiment about future expectations dropped 10% in the latest University of Michigan survey.
Here's a chart of the data:

This number should rebound if the shutdown ends soon, but, if it continues, sentiment will continue to drop. That will eventually lower purchasing activity for 70% of the economy.
Let's check in on Federal Reserve GDP predictions:
Atlanta:

NY Fed:

The Atlanta Fed is at 2.8% while the NY Fed is predicting 2.57% growth. It appears the sugar high from federal spending and tax cuts is starting to wane. Neither website mentions anything about the effect of the government shutdown. But see the comment above: it's not a matter of if it will impact the GDP but by how much.
Let's take a look at a few performance tables:

The market ended the week on a high note. This time, the larger-cap indexes led the way, followed by the riskier indexes. The reason is the rumor that China has a new proposal for ending the trade impasses, which, if true, would benefit larger companies. This also explains why the transports outperformed the other indexes by over a percentage point. I'm always interested when there's a modest difference in the performance of the IWMs and IWCs, only because the indexes are so closely related that they should track nearly identically. Once again, the long-end of the curve is modestly lower. 
For the week, all the indexes were higher, while the Treasury market was modestly lower. This is a standard bullish table.
Let's turn to the charts, which still contain a number of bullish elements.

Friday's chart is a classic rally. The morning rally had a number of advances and sell-offs, which shows a great balance between buyers and sellers in the market. Prices traded higher until right after lunch. The afternoon moves lower lasted about two hours and had two moves lower plus a counter-rally. None of these moves were pronounced. Prices consolidated losses in the upper Fibonacci bands as the market headed into the close. This is a nice chart to end the week with.

This is a wonderful chart. Prices advanced all week but continued the pattern of modest advance followed by disciplined profit-taking for most of the week. Prices gapped higher on Friday and kept moving up in the morning, only to fall back modestly in the afternoon. The 200-minute EMA (in pink) shows the overall trend was higher all week.

The two-week chart shows that SPY (NYSE:SPY) has been in a solid rally since January 7. There are three levels of support. The strongest is in the upper 250s, while the recent levels in the lower and mid-260s provide more recent footholds. 
Prices are now through the 50-day EMA and start next week just below the 200-day EMA - the line that separates bull and bear markets. In the last few days, the index has printed several strong candles, indicating bullish sentiment. The 10-day EMA has crossed over the 20-day EMA; both are now moving higher and should cross the 50-day EMA within the next few weeks. Momentum continues to rise. Since the absolute low of 233.76, the market has advanced nearly 14%.
The market has come a long way since the massive sell-off that started the year. However, it's prudent to remember the fundamental backdrop. The leading indicators are modestly softer, and there remains a great deal of political uncertainty caused by the budget impasse, trade tensions between the U.S. and China, and Brexit. I would expect these to dent the bullish trend at some point.
Disclosure: I/we have no positions in any stocks mentioned, and no plans to initiate any positions within the next 72 hours. I wrote this article myself, and it expresses my own opinions. I am not receiving compensation for it (other than from Seeking Alpha). I have no business relationship with any company whose stock is mentioned in this article.