
Summary
The lira is selling off sharply.
Don't be concerned about today's CPI print.
There's a fair amount of subtle bearishness in the markets right now.
The Turkey situation is growing more and more dire: consider the following chart of the USD versus the Turkish lira:

I've used the five-year time frame to place the current situation in historical context. Turkey has long been a bridge between the east and west. The increasingly autocratic nature of Erdogan's rule is starting to fray the relationship between Turkey and the West. The situation recently came to a head when Turkey imprisoned a priest and the US responded with a stiff round of sanctions. The two sides are currently trying to settle their differences, but we've heard no word of significant progress. Will this event be the historical tipping point when Turkey fully abandons the west by aligning itself with the east? China, after all, has positioned itself as the banking and infrastructure bank to the developing world through its belt and road program (although it's starting to run into trouble), making it the logical partner to bail Turkey out of its problems. While no one knows the answer, Turkey's current leader would probably be more comfortable with a strongman like China's Xi instead of the institutionally oriented NATO.
Is inflation heating up? Maybe.
From the BLS's CPI release earlier today:
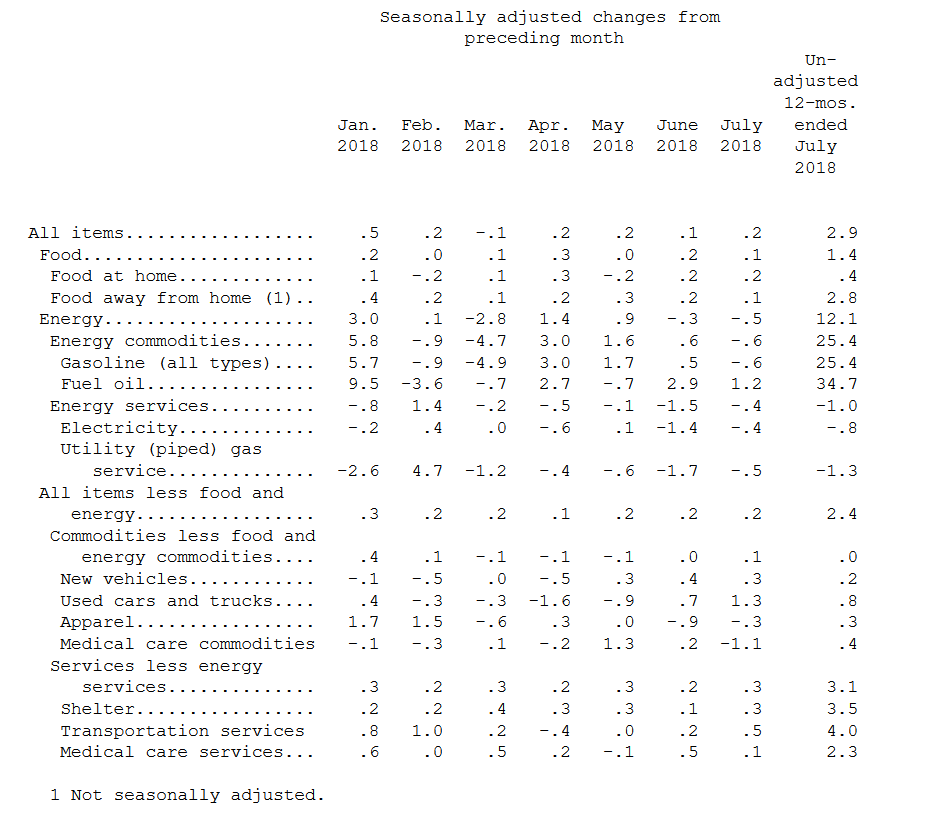
All-item CPI is up nearly 3% while core is up 2.4%. Here's a chart of the data:

Both are rising and over 2%. However, before we hear about runaway inflation, remember that prices have only been over the Fed's 2% target for few months, which is nothing in economic terms. And the 2% inflation target is symmetric - prices can be below or about that number; the Fed is concerned when they remain above or below for an extended period of time. Finally, the Fed prefers the PCE price index to CPI. Here's a chart of that data:

Both are right around 2%.
It's been a very good earnings season. From FactSet:
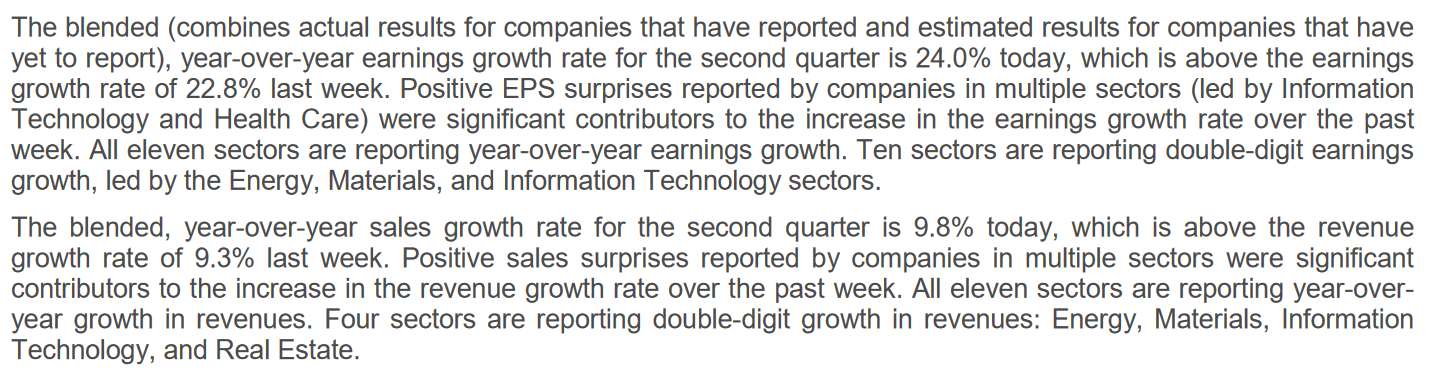
Are we at peak earnings? If not this quarter, then over the next few. Here's why. 1Q18 and 2Q18 earnings numbers were positively impacted by the Tax Cuts and Jobs Act that was passed in 4Q17. That means Y/Y earnings comparisons in 1Q-2Q19 will be extremely tough. Tariffs are just starting to be implemented in a number of countries as well, so it's possible 1H18 numbers were abnormally high as sales were pulled forward. This means that we could see diminished trade activity in 2H18, further lowering growth. This, of course, is speculative. But I'm not the first person to make these observations.
Let's turn to the indexes, starting with the weekly performance table:
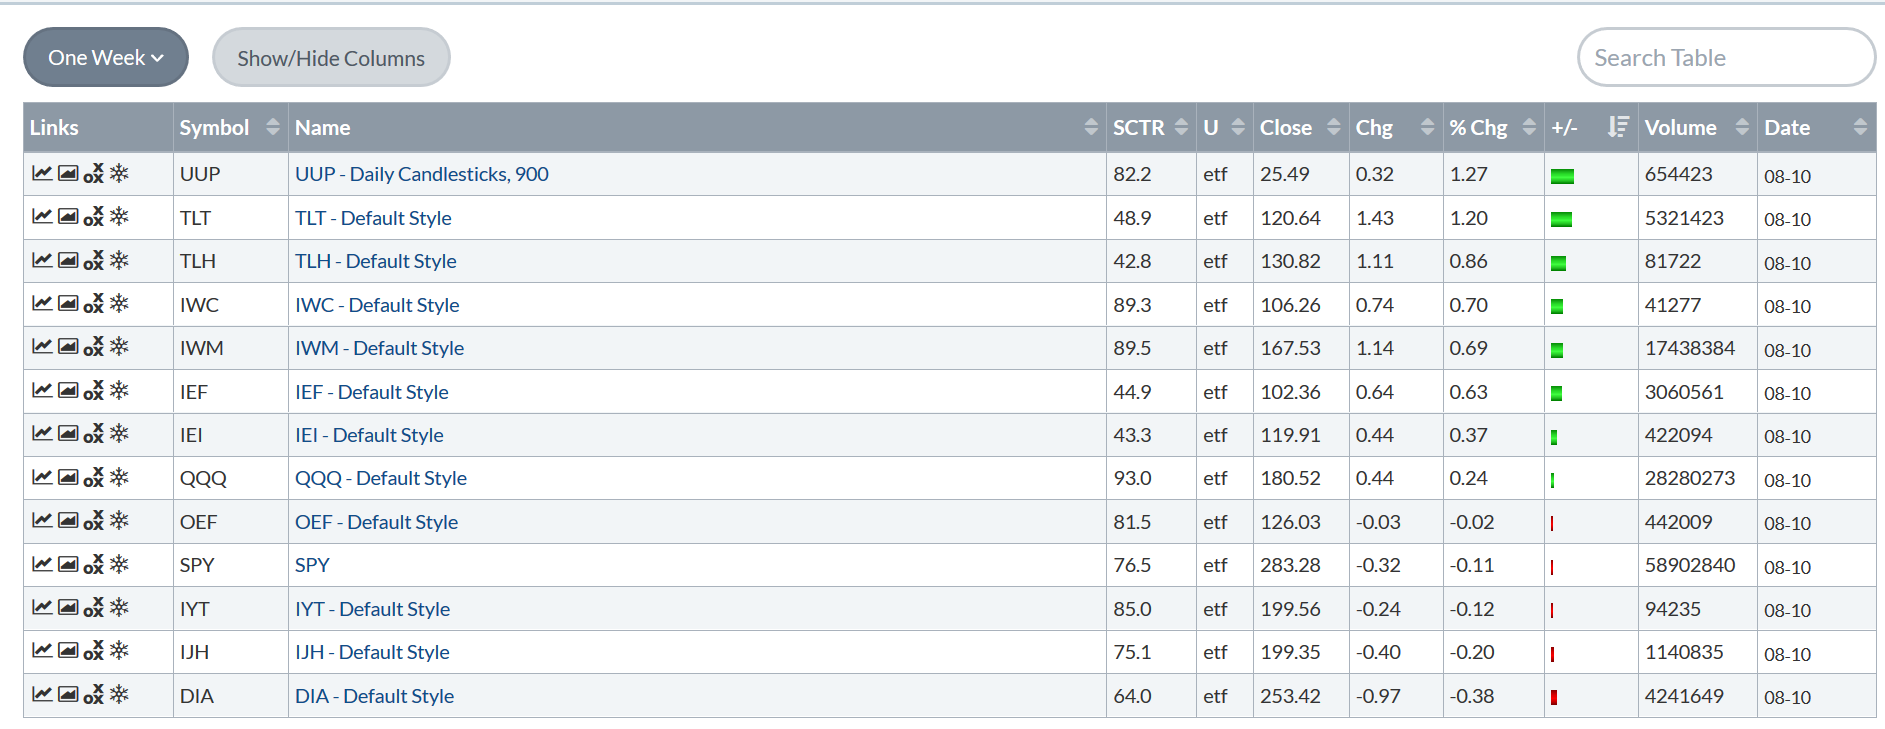
The dollar outperformed all the indexes, largely because traders bought US currency and sold the lira (see above). The long end of the Treasury market outperformed all the indexes, which is interesting considering the strong CPI print on Friday. This tells us that traders aren't fearing an uptick in inflation. I'm guessing there's a fair amount of safety bidding in there as well. The larger averages sold off, but just barely.
All week long, I've noted the bearishness in multiple time frames on the SPY. Just to refresh your memory, here's that chart:

Prices printed three shooting star formations in a row this week. That's probably the last time that will happen in our lifetimes, so remember this moment. As I also noted, this is a bearish development, which also explains why prices moved lower on Friday.

We see the same situation on the QQQ. But this happened in combination with prices hitting previous highs and then falling back. That's a bad development technically; it indicates there just wasn't enough momentum to keep the rally going. And the fact that prices sold-off on Friday indicates traders are concerned that bad news could happen over the weekend (think: Turkey).

The Russell 2000 broke its uptrend at the end of July. The same trend line has been providing upside resistance instead of support.
There's a great deal of subtle bearishness in the markets right now. It's not fatal by any stretch of the imagination. But considering it's happening after a very strong GDP print and one of the best earnings season in a long time, it's probably something to be very aware of.
Disclosure: I/we have no positions in any stocks mentioned, and no plans to initiate any positions within the next 72 hours.
I wrote this article myself, and it expresses my own opinions. I am not receiving compensation for it (other than from Seeking Alpha). I have no business relationship with any company whose stock is mentioned in this article.