
Summary- Markit's global PMIs remain mostly positive. Cracks are developing, however.
- The trade gap rose sharply; emerging markets with dollar-denominated external debt and declining currencies face growing problems.
- Today, the markets were flat.
How worried should we be about the global economy, really? That's a really good question and the answer is, "a bit." This week, Markit Economics released the latest round of PMIs, and the data is mixed. China's number is barely positive: it fell from 50.8 to 50.6. Export orders have declined for five months; new business was the slowest in 15 months. On the other hand, Indonesia's number rose from 50.5 - 51.9; the Philippine reading also increased; Taiwan's was marginally lower. But Myanmar is now in a contraction. The overall global manufacturing index is moving lower but is still a fairly healthy 52.5. Even there, we should be a bit concerned: overall new orders are near 2-year lows. It's important to remember that economics is slow-moving. While Trump announced tariffs a few months ago, they are just now starting to take effect. The environment hasn't fallen apart. There are cracks, however.
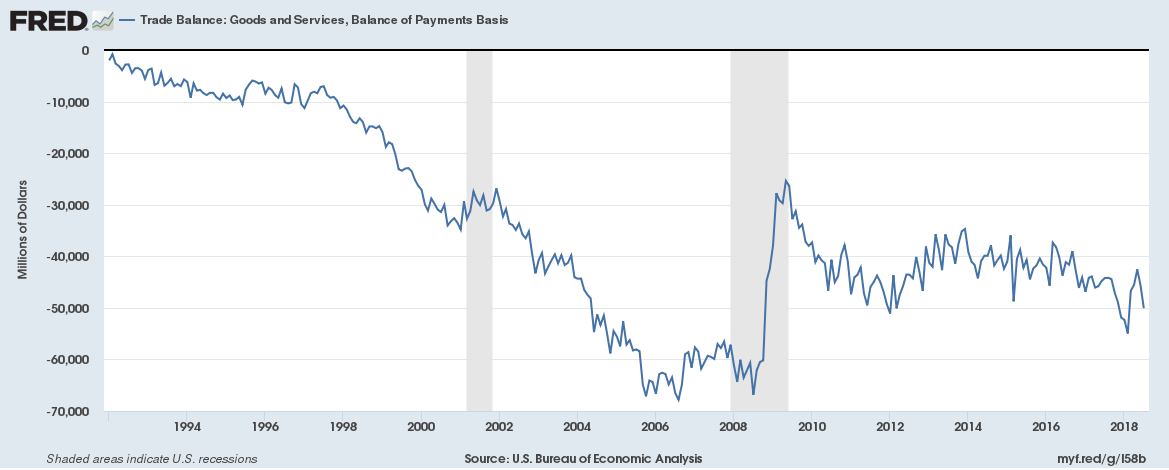
The trade gap hit a three-year high [emphasis added]:
The U.S. trade deficit increased to a five-month high in July as exports of soybeans and civilian aircraft declined and imports hit a record high, suggesting that trade could be a drag on economic growth in the third quarter.
The increase was the biggest monthly widening since 2015.
The Commerce Department said on Wednesday the trade gap jumped 9.5 percent to $50.1 billion, widening for a second straight month. Data for June was revised to show the trade deficit rising to $45.7 billion, instead of the previously reported $46.3 billion.
As I noted when the BEA released their second estimate of 2Q18 GDP, exports were disproportionately strong:
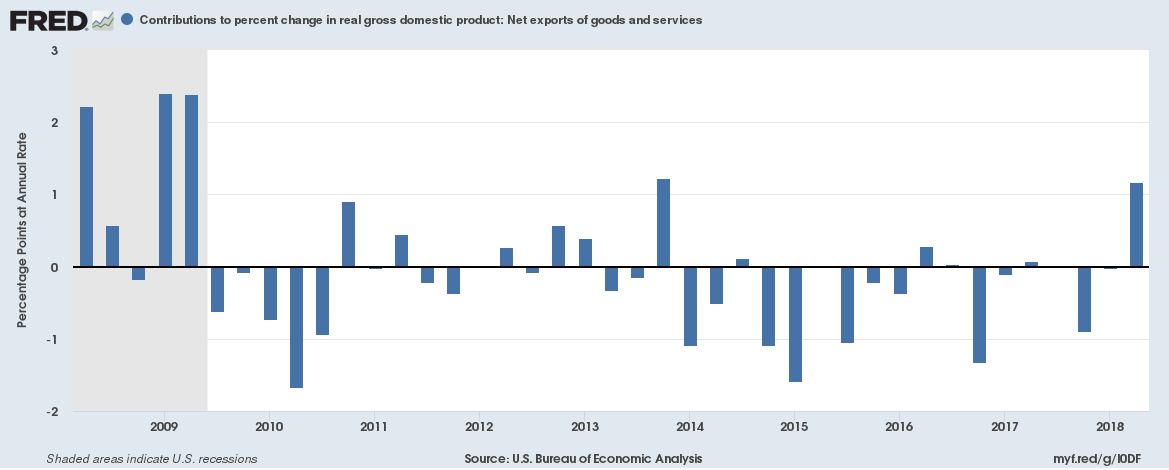
It appears that the tariffs pulled sales forward in the second quarter. Which leads to this result:
The trade balance going in the wrong direction, at least according to the president.
Let's put the EM situation into perspective, shall we? The following table is from Michael Lebowitz's Twitter feed:
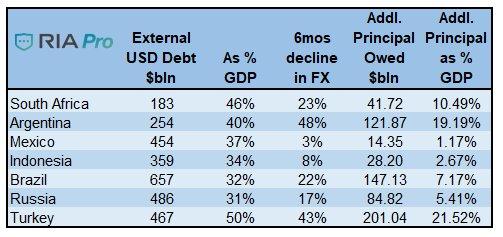
It shows the increased burden placed on emerging markets that have declining currency and large dollar-denominated debts. South Africa, Argentina, and Turkey are in especially dire straits over this.
When we last left the market, it was in the middle of a rally but was taking a modest breather from recent gains. That trend (more or less) continued today:
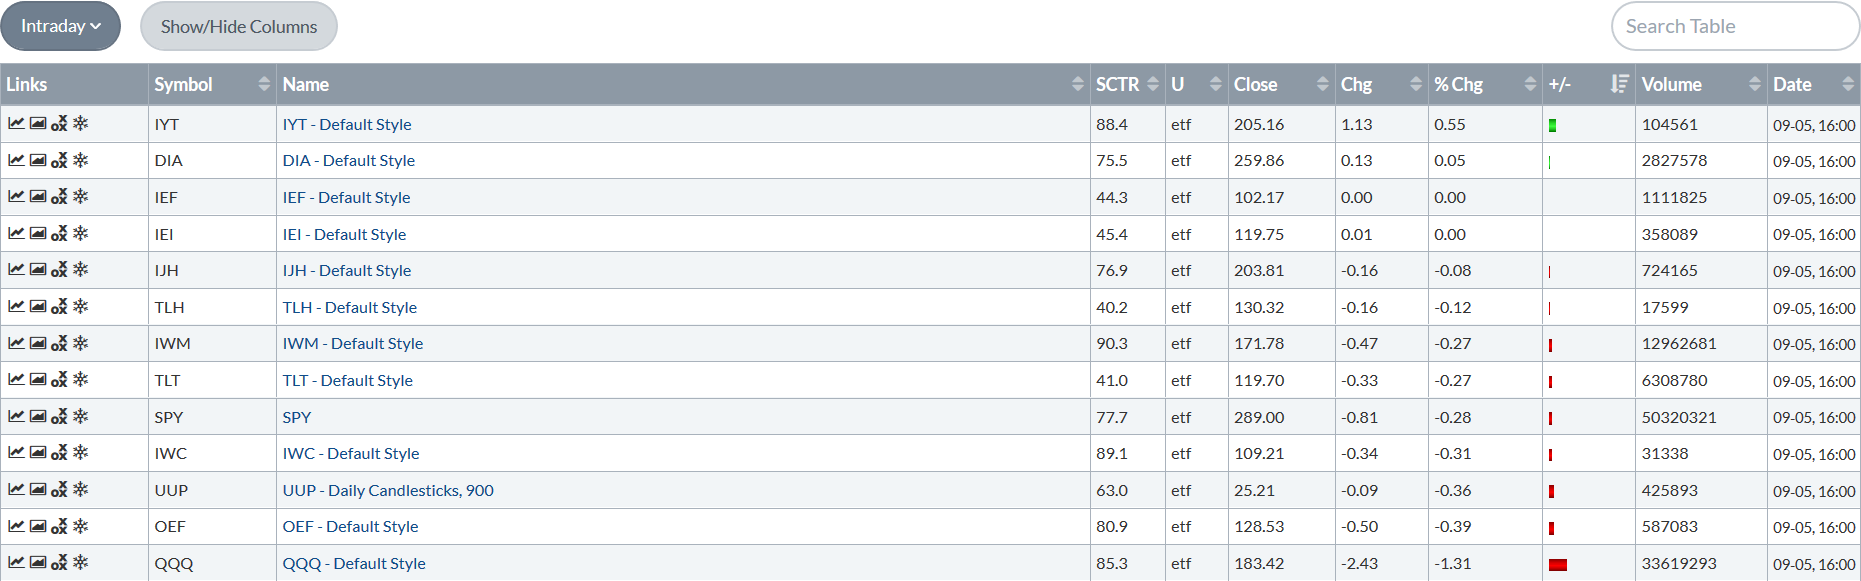
Transports were up and the Nasdaq was down, but the rest of the market was more or less flat. Mid-caps were down .08, the SPDR S&P 500 (NYSE:SPY) were down .2, the Dow Jones Industrial Average were up modestly. Basically, all the indexes traded around the 0% line
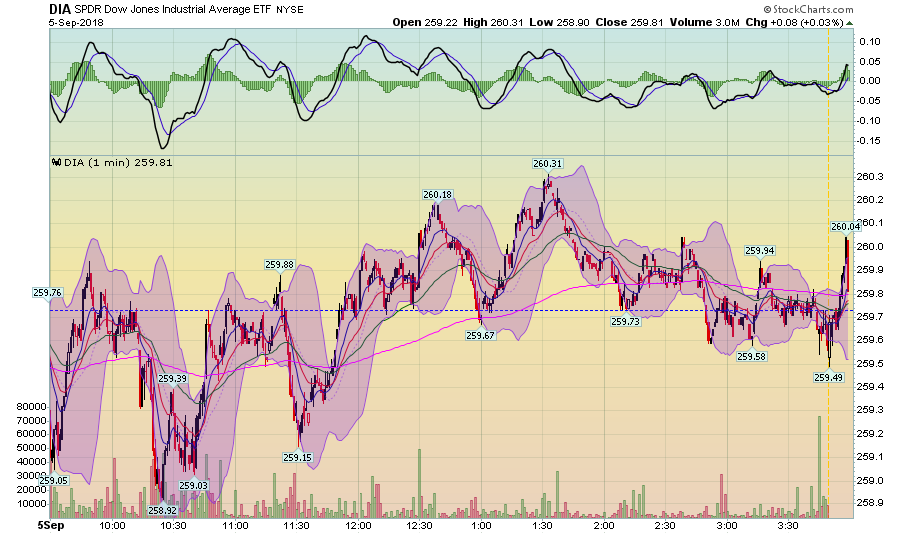
The 1-day chart for the DIAs typifies the action. Prices were below yesterday's close for the morning, then used the close for technical support for the remainder of the day. In reality, they fluctuated around a mean.
Pulling the camera back, we get the 5-minute charts for the SPYs and Invesco QQQ Trust Series 1 (NASDAQ:QQQ):
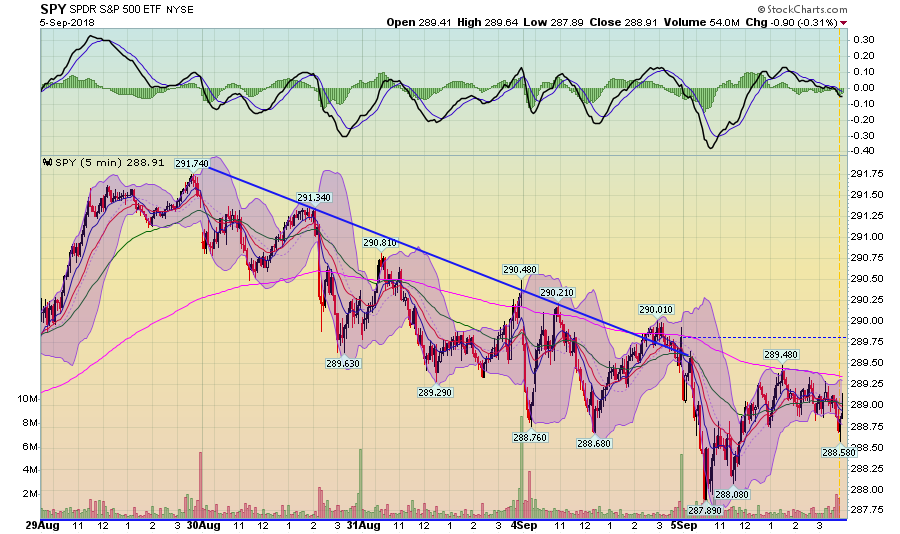
The SPYs moved gently lower, creating a very disciplined downward move that ended with today's action, where the market was slightly lower.
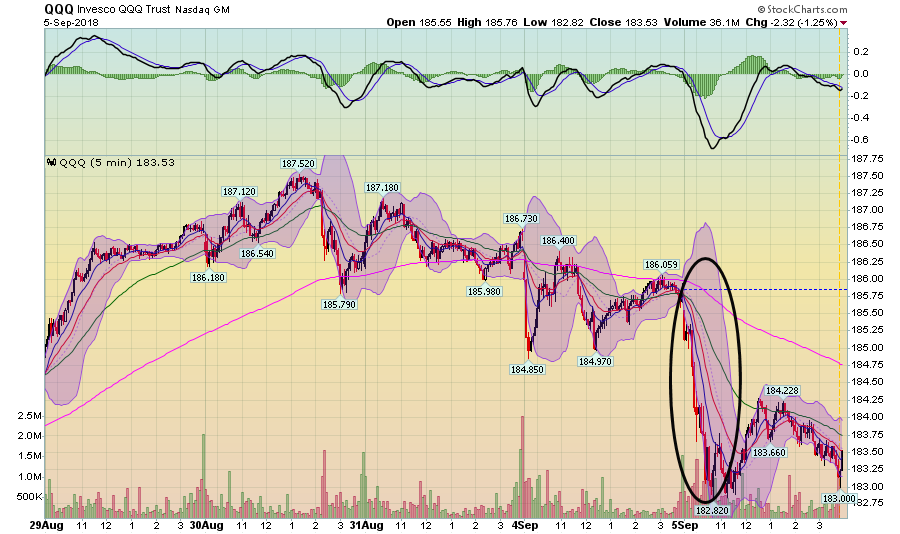
Then we have the QQQs, which dropped sharply at the open for political reasons -- the testimony of tech executives on Capitol Hill. Prices closed near lows for the day.
Over the last week, there was a great deal of press about the market making new highs (finally). The 30-day charts show that prices have pulled back from those levels to standard support regions:
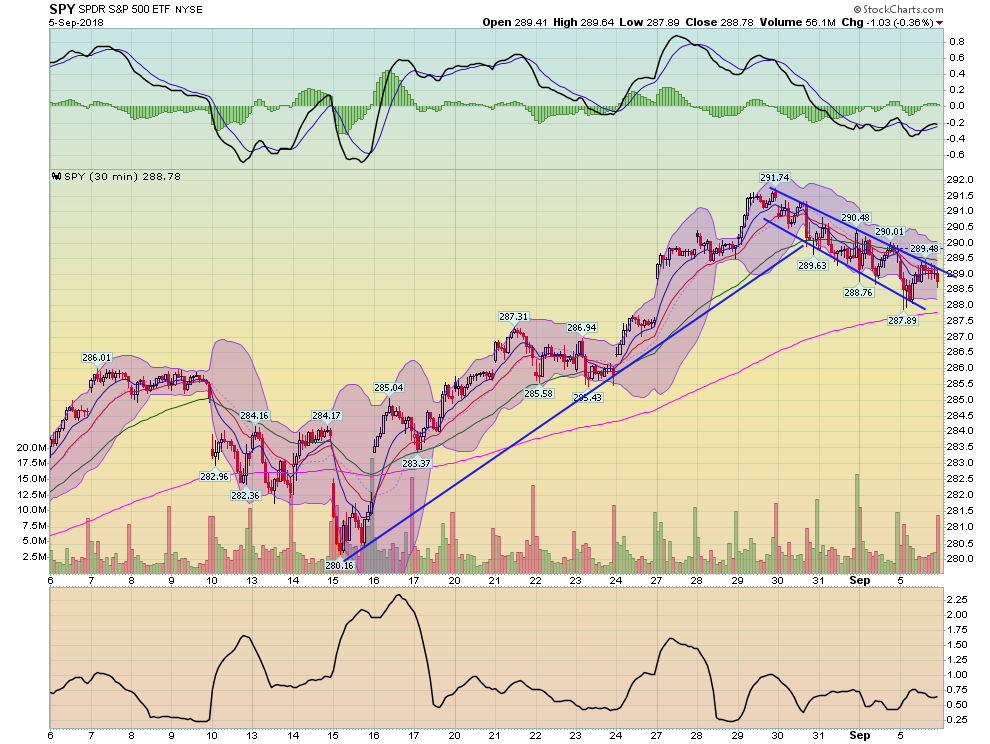
The SPYs broke their trend a few days ago and have been moving slowly lower, approaching the 200-minute EMA.
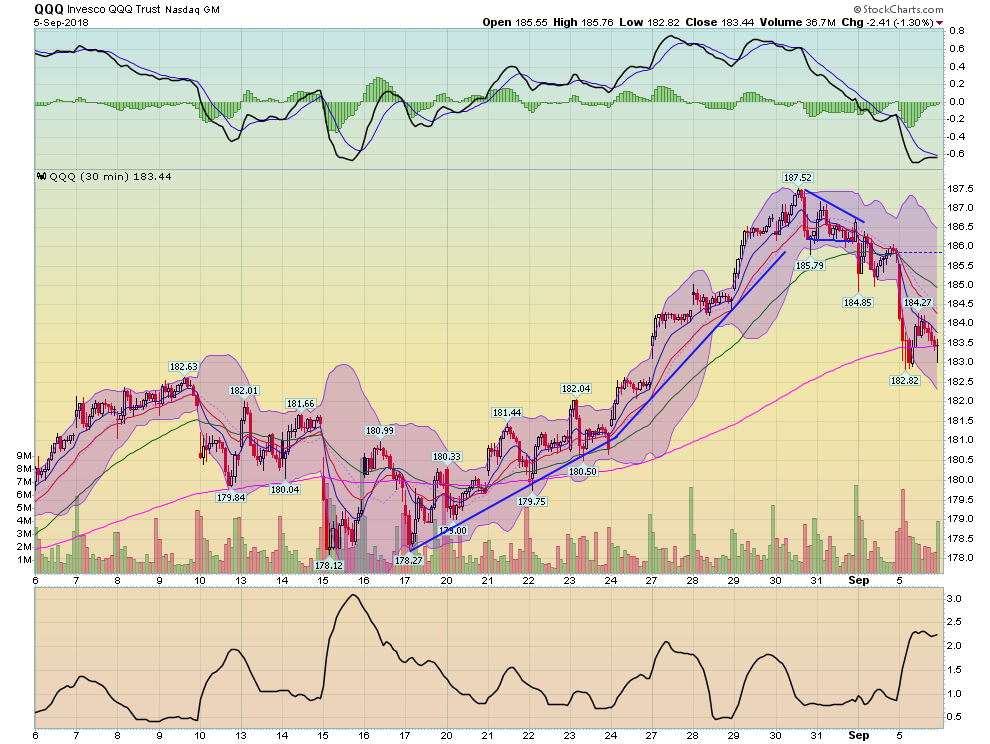
The QQQs move was a bit sharper, due to today's very sharp drop at the open.
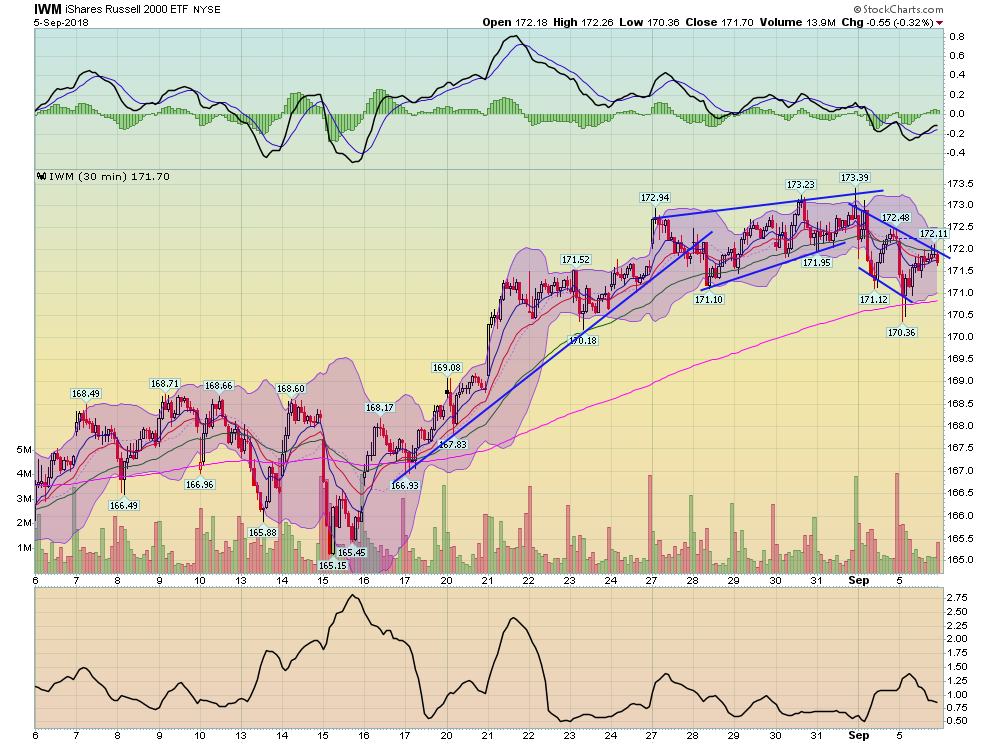
The iShares Russell 2000 (NYSE:IWM) action is a bit more herky-jerky but it follows the same overall pattern.
Ultimately, the market is selling off a touch after a solid move higher through resistance. This is a good -- and natural -- development.
Disclosure:I/we have no positions in any stocks mentioned, and no plans to initiate any positions within the next 72 hours.
I wrote this article myself, and it expresses my own opinions. I am not receiving compensation for it (other than from Seeking Alpha). I have no business relationship with any company whose stock is mentioned in this article.