
- All Instrument Types
- Indices
- Equities
- ETFs
- Funds
- Commodities
- Currencies
- Crypto
- Bonds
- Certificates
Please try another search

See the stocks on our ProPicks radar. These strategies gained 19.7% year-to-date.
Technically Speaking For September

Summary
Crude oil is picking up some steam.
Although there is talk about treasury yields moving higher, the 5 and 10-year breakeven inflation rate says that's not going to happen.
This was a very political day in the market.
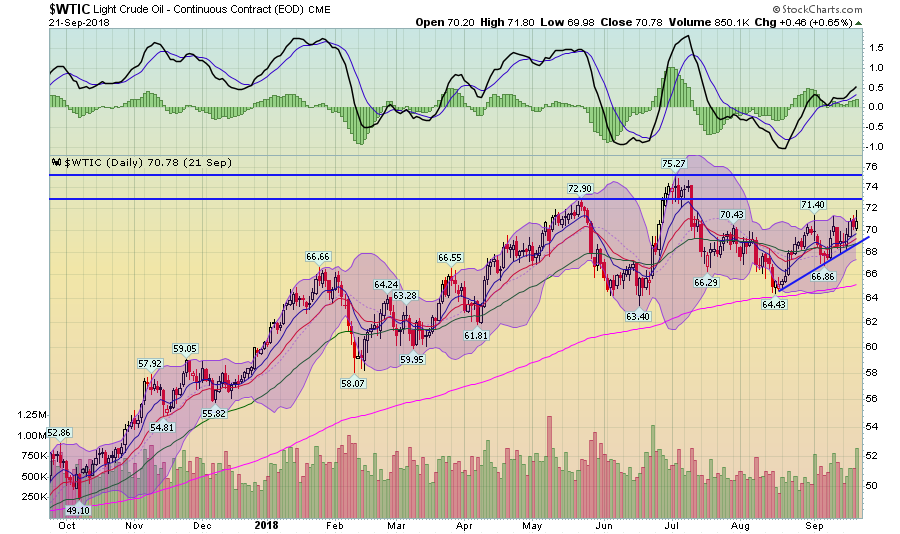
Oil is again rearing its head. Here's what's happening. When the U.S. left the Iran deal, they also reimposed sanctions on the regime and any business that did business with Iran. That means that no one can buy Iranian oil as of early November. Sales are already dropping off. Decreasing supply = higher prices. Compounding the problem is that OPEC -- which has diminished market power but still sits in Dad's chair at the end of the table -- isn't increasing production. And with the world economy still expanding, demand is rising. So, let's use basic microeconomic concepts, shall we? Decreasing supply plus increasing demand equals higher prices. And that's what we're seeing:
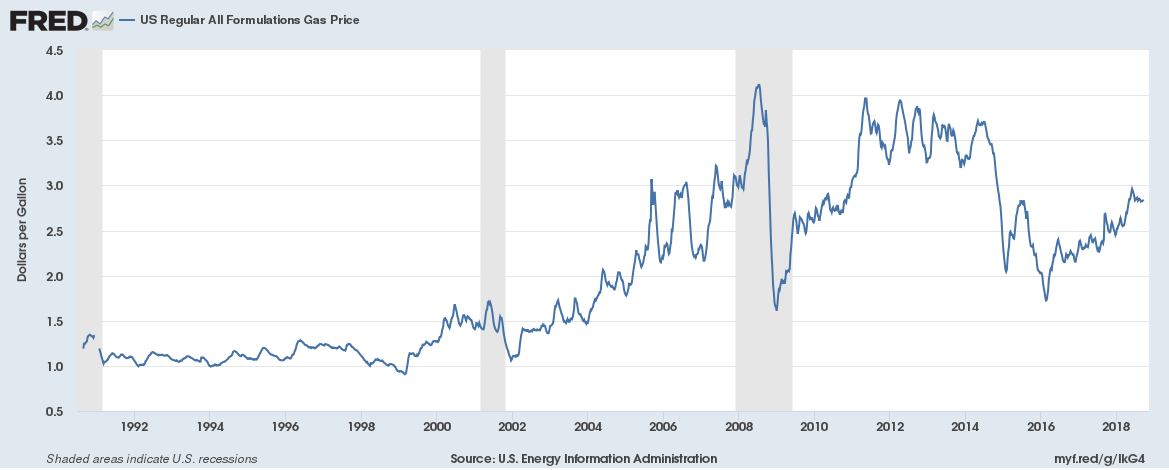
Prices are now in a short-term uptrend; they've risen from 64 to the lower 70s. They are still below previous highs, however. Meanwhile, gas prices continue to inch higher:
Nationally, prices came close to hitting $3/gal but backed off. However, there is a clear uptrend in place that should continue with the decrease in supply.
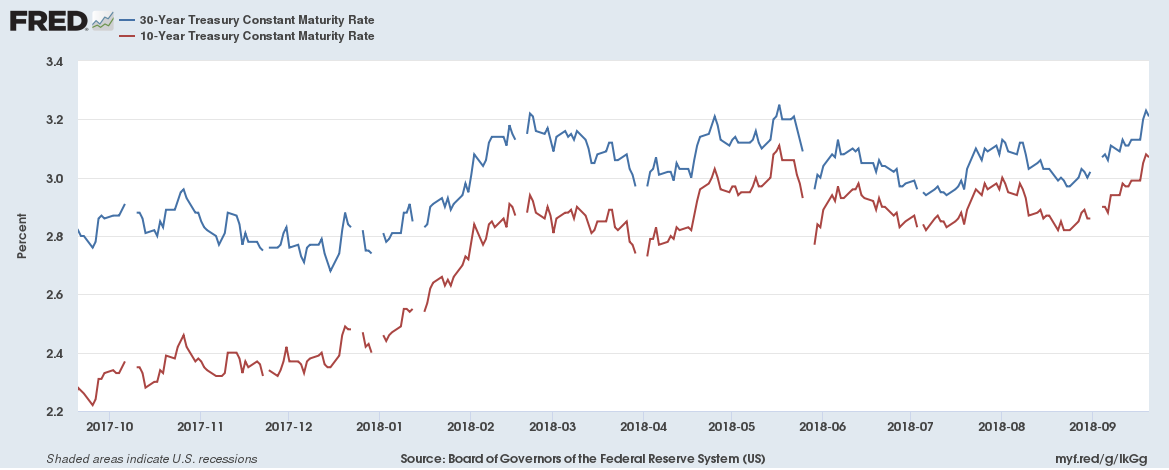
Let's talk about the yield curve, starting with the 10- and 30-year treasury:
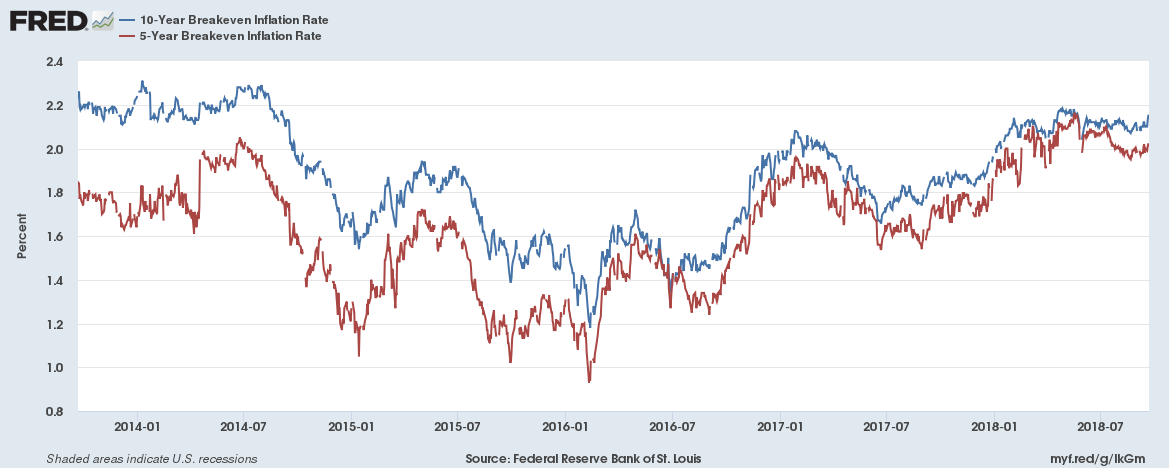
Both have risen a little over 20 basis points over the last few months. That might not seem like a big deal. However, in the bond market, it is. Are they going to keep moving higher? I'm not seeing a big move. Why? Inflation expectations are still contained:
Both the 5 and 10-year breakeven inflation rates are moving sideways. We'd have to see what would amount to a fundamental change in how the markets are thinking about future inflation for the treasury market to keep moving higher in any meaningful way. And with the Fed in a rate-hiking mood, I'm just not seeing it.
is Sears (NASDAQ:SHLD) still around? Evidently, it is. How is utterly beyond me -- this is a company that should have died 20-30 years ago. Today, the FT reported that the company is looking to restructure its debt. Good luck with that. Oh -- and can we please fire anybody that thought buying Sears debt in the first place was a good idea?
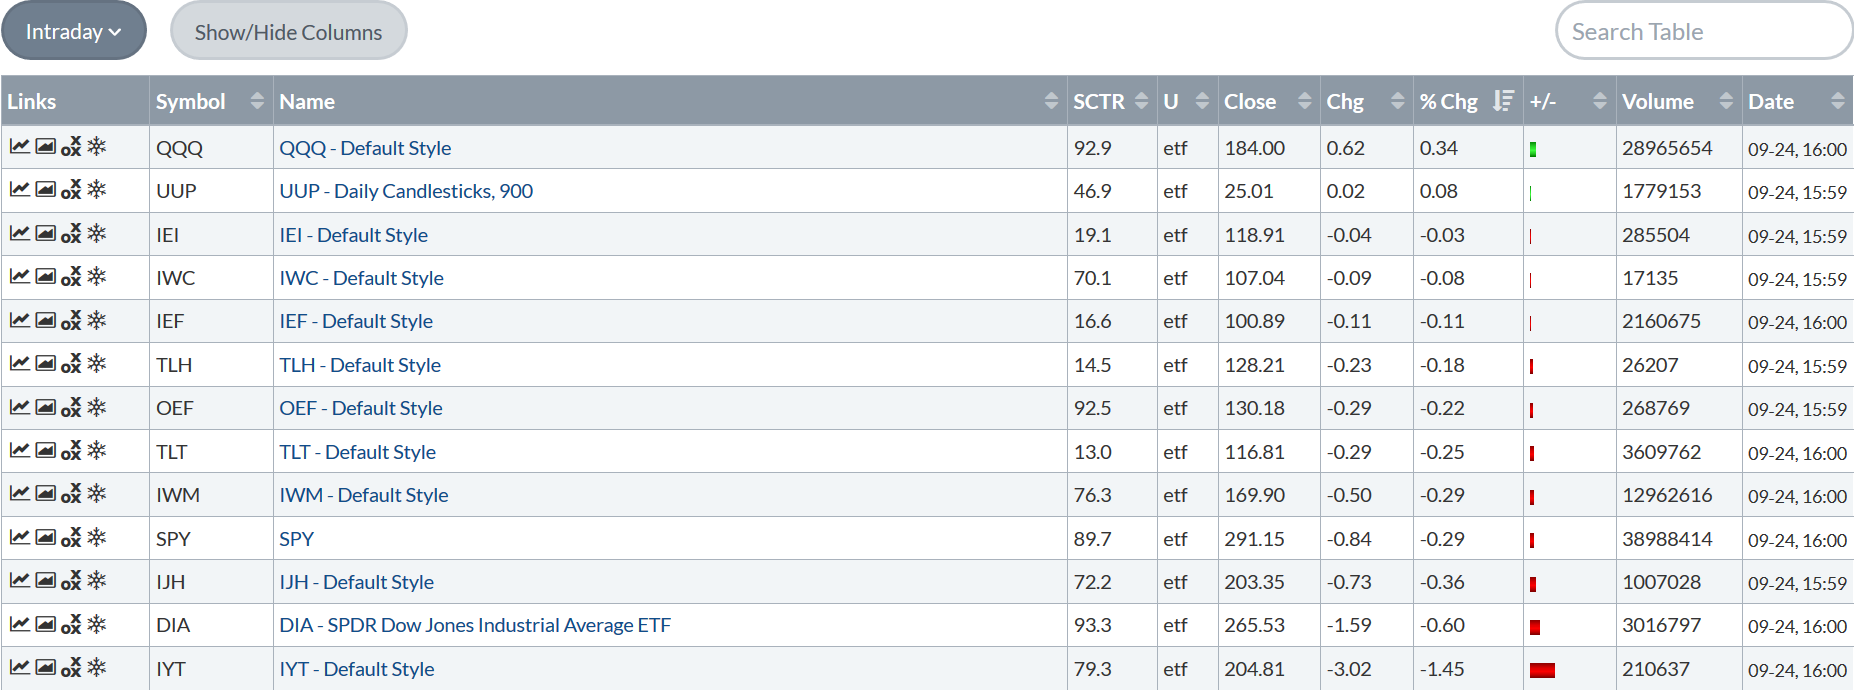
Turning to the markets, let's see how we did today.
This was a day to remind us that every so often, the markets get political (and please, let's avoid any political pie fights in the comments section, OK?). The Rosenstein news sent the markets lower, but they rebounded as things seemed to calm down (relatively speaking) by days end.
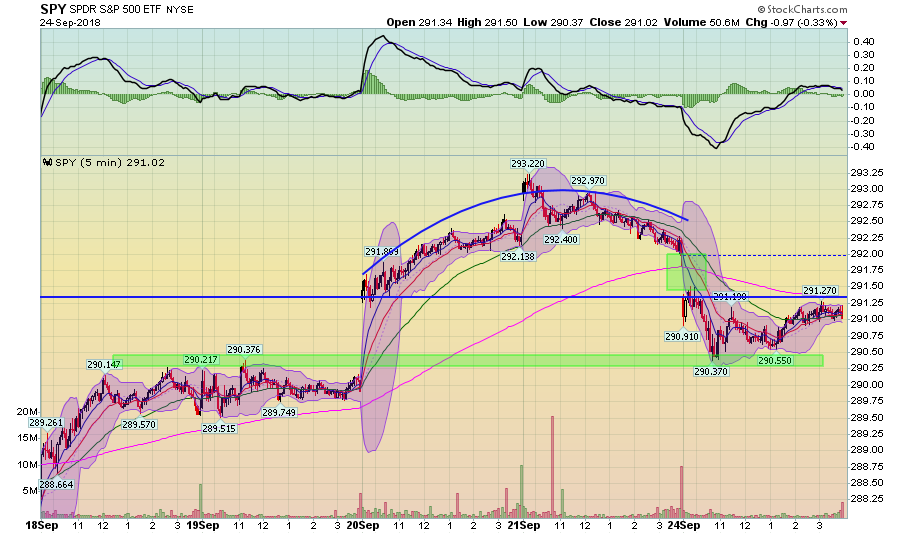
Rather than looking at a single days chart, let's put the action in place with a 5-day chart:
Prices gapped higher on Thursday, kept moving higher into Friday's open, and then moved lower. This AM they gapped lower, falling to the highs from earlier in the week. But by the end, the SPY (NYSE:SPY) was near its opening level, making a round-trip more or less.
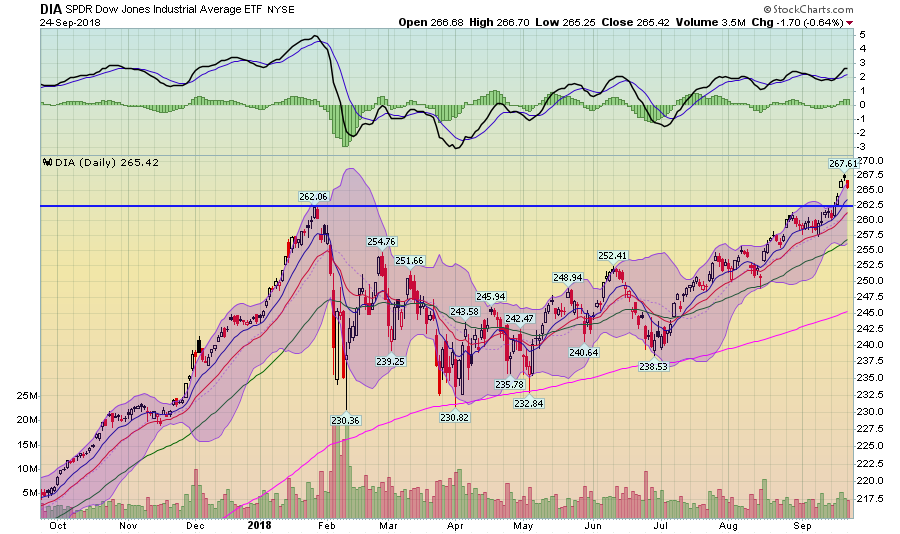
Final question -- are we looking at an island formation in the DIA?
Prices have gapped higher. But we see a bar up, a star, and a bar down -- literally, the best example you'll see of an island formation out there.
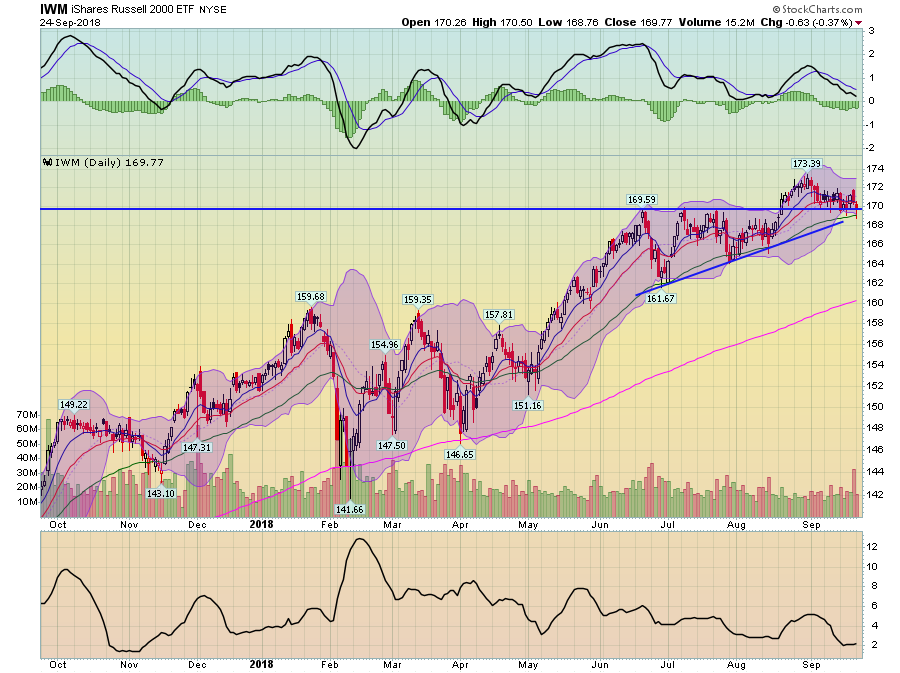
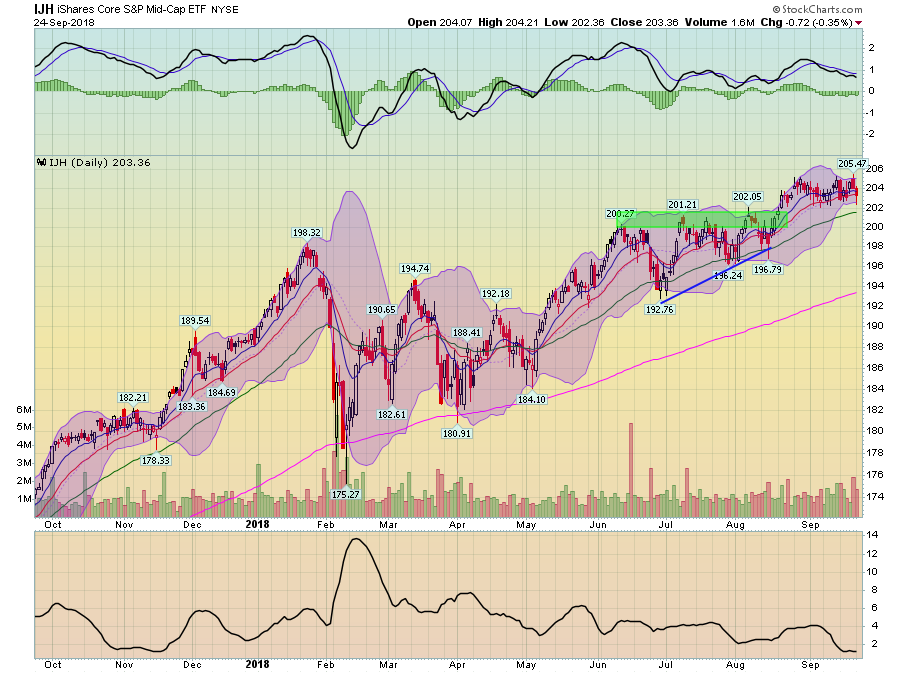
And the riskier averages aren't helping:
The IWM is moving lower, getting support from the highs of mid-June.
And the IJH is moving sideways.
Stay tuned, TA friends. More will be revealed at tomorrow's open.
Disclosure: I/we have no positions in any stocks mentioned, and no plans to initiate any positions within the next 72 hours.
I wrote this article myself, and it expresses my own opinions. I am not receiving compensation for it (other than from Seeking Alpha). I have no business relationship with any company whose stock is mentioned in this article.
Related Articles

The ETF landscape in the U.S. is vast and varied, with the ETF Central screener showing some 3,479 U.S.-listed ETFs as of April 4th.This number is particularly dynamic, as numerous...

As for the economy, the federal government (the Bureau of Economic Analysis) released its third estimate of real gross domestic product (GDP) growth recently at 3.4% (annual rate)...

by Jack FischerDuring LSEG Lipper’s fund-flows week that ended March 27, 2024, investors were overall net redeemers of fund assets (including both conventional funds and...
Are you sure you want to block %USER_NAME%?
By doing so, you and %USER_NAME% will not be able to see any of each other's Investing.com's posts.
%USER_NAME% was successfully added to your Block List
Since you’ve just unblocked this person, you must wait 48 hours before renewing the block.
I feel that this comment is:
Thank You!
Your report has been sent to our moderators for review



Add a Comment
We encourage you to use comments to engage with other users, share your perspective and ask questions of authors and each other. However, in order to maintain the high level of discourse we’ve all come to value and expect, please keep the following criteria in mind:
Enrich the conversation, don’t trash it.
Stay focused and on track. Only post material that’s relevant to the topic being discussed.
Be respectful. Even negative opinions can be framed positively and diplomatically. Avoid profanity, slander or personal attacks directed at an author or another user. Racism, sexism and other forms of discrimination will not be tolerated.
Perpetrators of spam or abuse will be deleted from the site and prohibited from future registration at Investing.com’s discretion.