
- All Instrument Types
- Indices
- Equities
- ETFs
- Funds
- Commodities
- Currencies
- Crypto
- Bonds
- Certificates
Please try another search

Technically Speaking For October 22

Summary- Netflix (NASDAQ:NFLX) is -- once again -- tapping the debt market.
- The FANG stocks are down for the latest one and three-month period.
- Today's action was mixed; the markets are still trying to find a bottom.
Netflix is one of the FANG stocks -- four of the largest and most influential tech issues that are primary drivers of the current rally. Today, the company announced yet another venture into the bond market to raise cash to fund the development of original content. This further exacerbates the company’s primary problem, which is its inability to generate positive cash flow, which has been negative since 2015. EBITDA was a paltry 11% of gross revenue for the trailing 12 months. While the debt/asset ratio is still a very conservative 35%, I have reservations about the value of the company’s digital assets. Although the company is still in the middle of its growth “glory days,” it isn’t making any kind of financial pivot to a sustainable growth model.
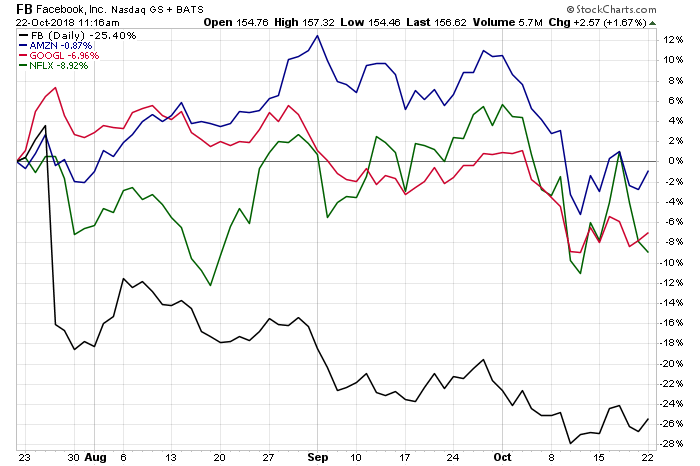
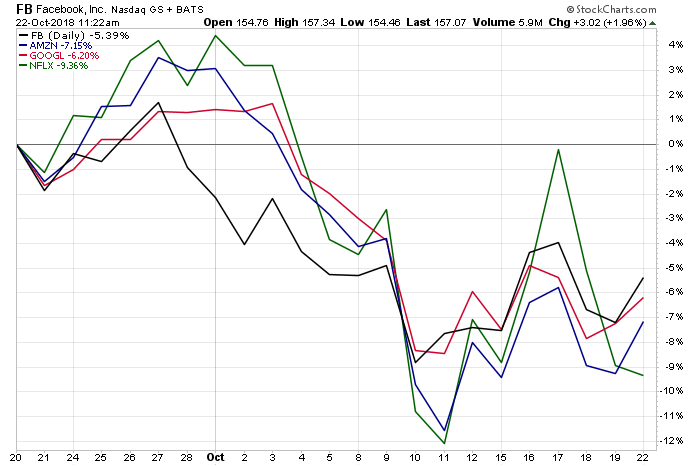
And speaking of the FANGs, they haven’t been doing well lately:
The top chart shows the group’s three-month performance while the bottom chart shows the group’s one-month performance. All of the issues are down over these periods. This partially explains the indexes weaker performance since mid-August.
So far, revenue growth from the latest earnings season is growing nicely:
The blended (year-over-year) revenue growth rate for Q3 2018 is 7.4%. All eleven sectors are reporting (or are expected to report) year-over-year growth in revenue. Three sectors are reporting double-digit growth in revenue: Energy, Communication Services, and Real Estate.
I prefer looking at gross revenue because it's much harder to fudge/manipulate the numbers than earnings.
Let's place the latest price action into a more recent perspective. After selling off a few weeks ago, prices are "pinballing" between several key technical levels. Think of this as working off the momentum from the sell-off.
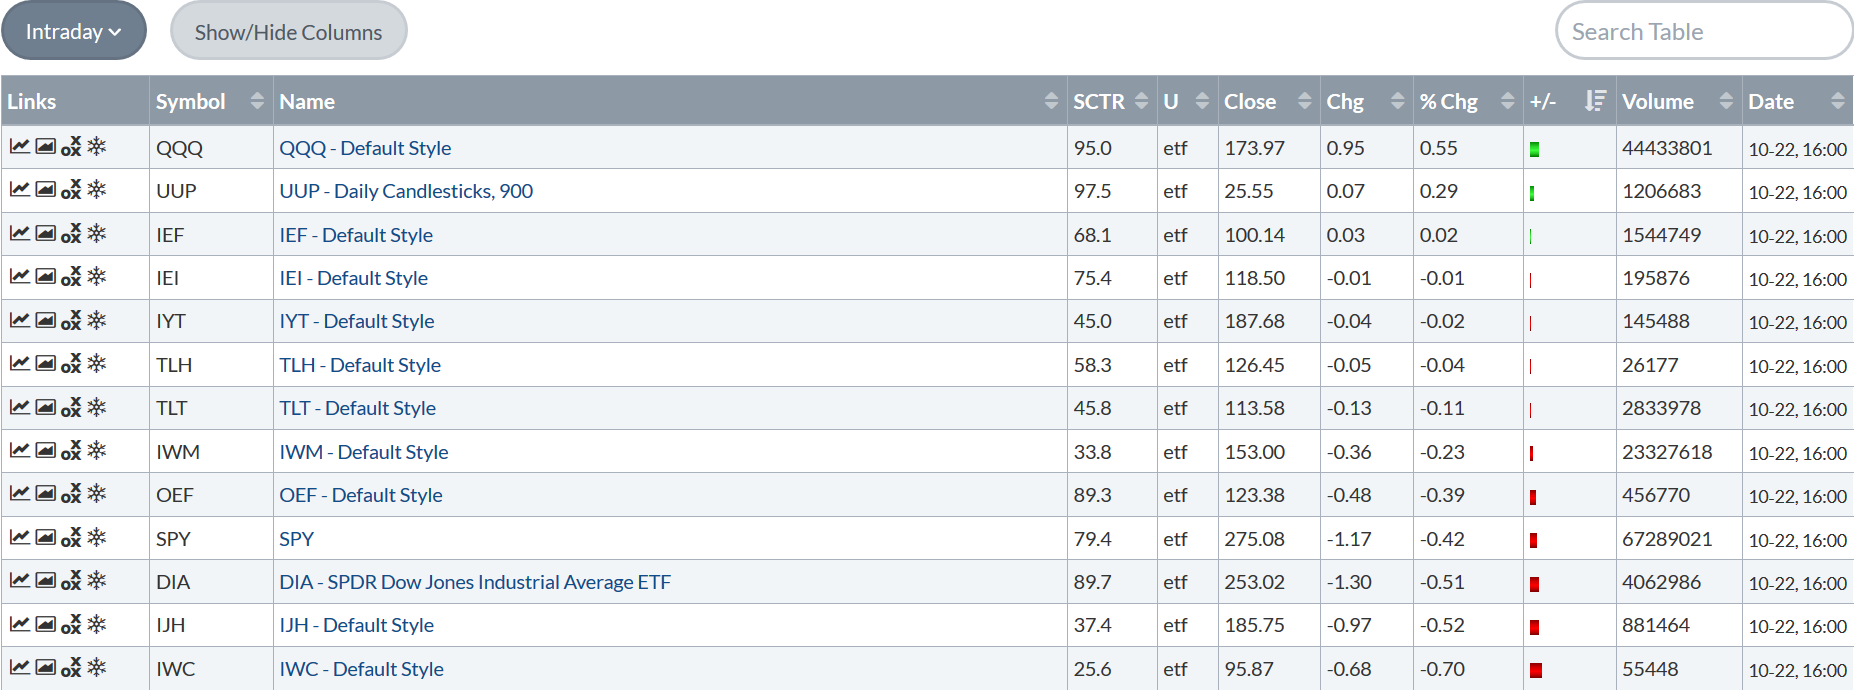
With all that in mind, let's take a look a today's performance table:
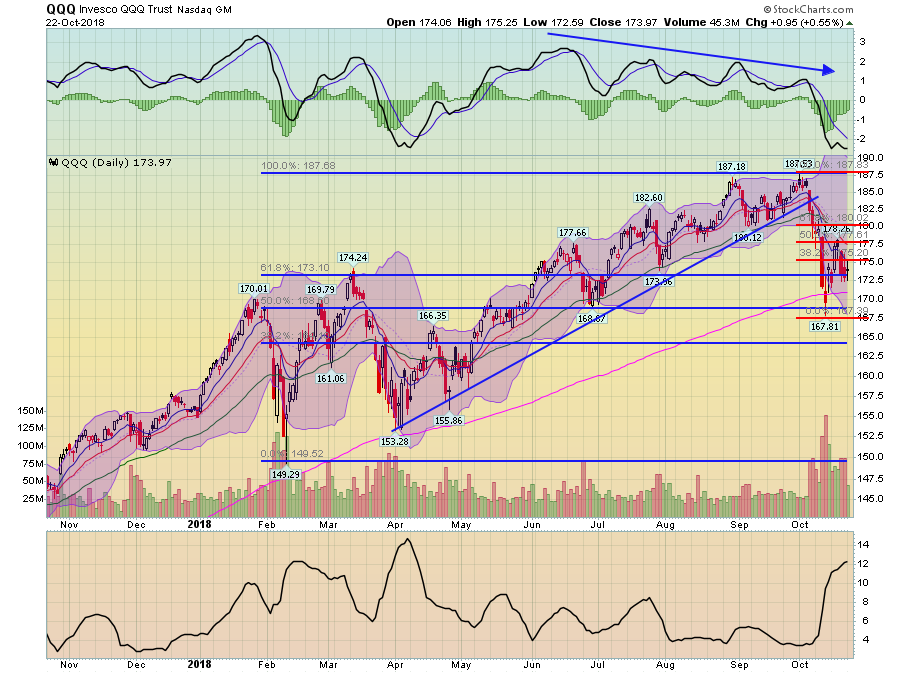
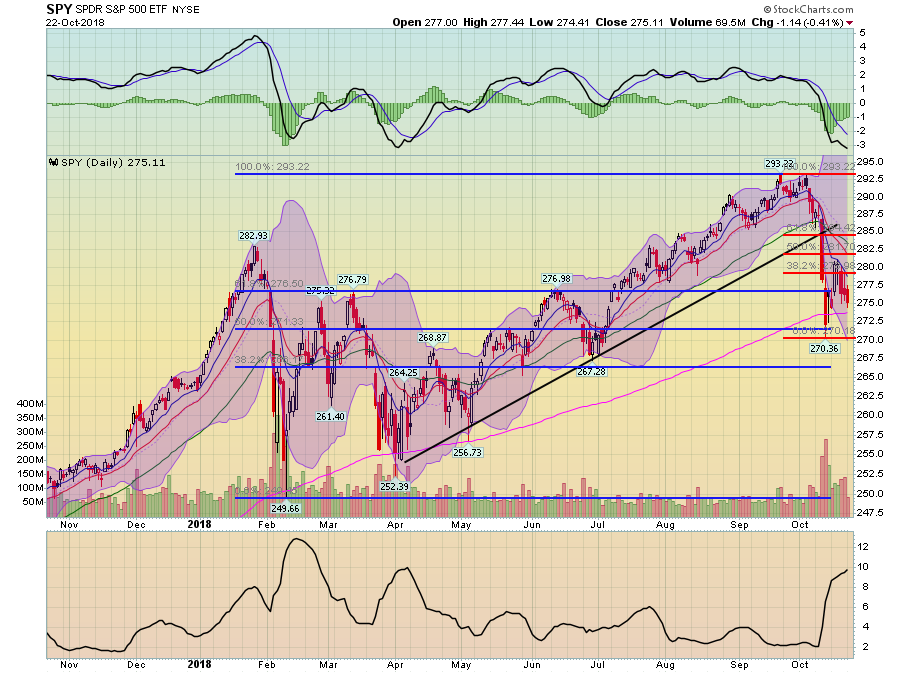
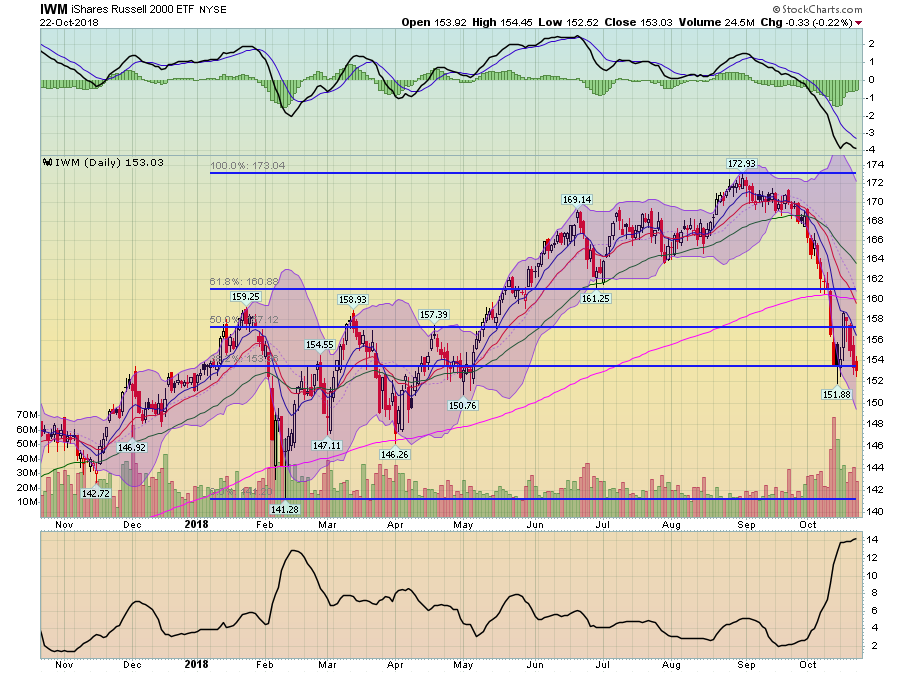
Today was very mixed. The Invesco QQQ Trust Series 1 (NASDAQ:QQQ) was the best performer, rising a little over .5%, but the micros were the worst performer, falling .7%. Interestingly, the iShares Russell 2000 (NYSE:IWM) was only off .23%, which, considering that it's a riskier index than the SPY (NYSE:SPY) or iShares S&P 100 (NYSE:OEF), is a bit odd.
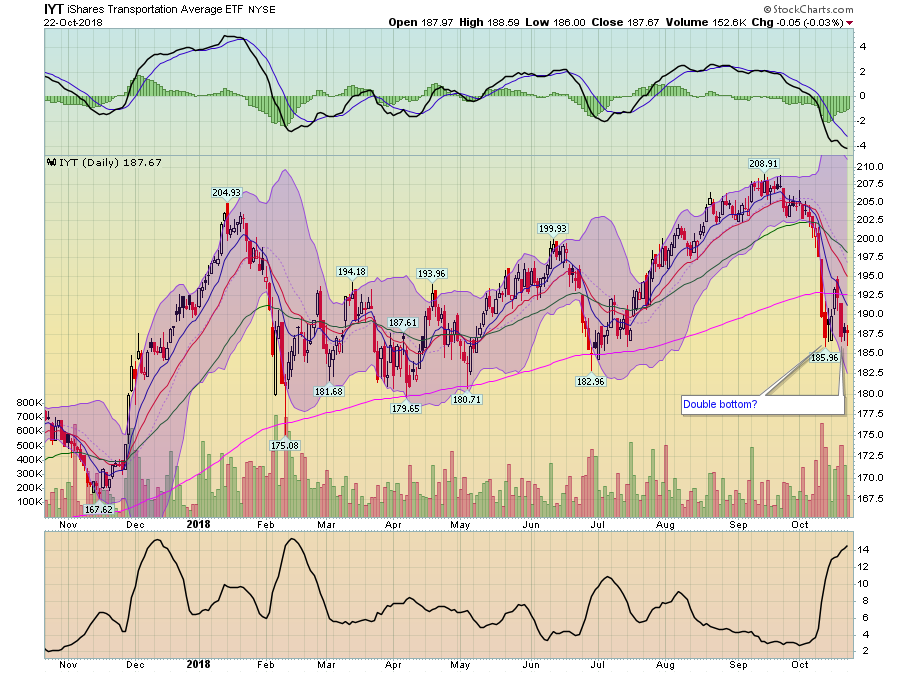
In looking at the charts, we're looking for signs that we're bottoming, starting with the transports:
This is an ancillary index. It's possible prices could be forming a double bottom. Notice the big drop in volume, which means the sell-off might be tapering off.
The QQQ looks to be settling right around the 61.8% Fib level that connects the lows from early February with the highs of early October. The 200-day EMA is a natural level to target should the Fib level not hold. Like the iShares Transportation Average (NYSE:IYT), there is also a drop-off in volume.
The SPY is right at the 61.8% Fib level. However, don't be surprised if the 200-day EMA becomes the next center of gravity.
This is the one we really want to keep our eyes on. Prices are right at the 38.2% Fib level. If that doesn't hold, look for the lower 150s and then the mid-140s.
The good news is that volume is declining, which means the downside momentum is weaker as well. But we're not out of the woods yet. My instincts tell me we need at least another week of this before we can say the bottom is in.
Disclosure: I/we have no positions in any stocks mentioned, and no plans to initiate any positions within the next 72 hours.
I wrote this article myself, and it expresses my own opinions. I am not receiving compensation for it (other than from Seeking Alpha). I have no business relationship with any company whose stock is mentioned in this article.
Related Articles

Real estate ETFs are facing significant headwinds, entering their third consecutive week of downturns (-3.16% week over week) and affirming their position as this year's laggard...

As for the economy, the federal government (the Bureau of Economic Analysis) released its third estimate of real gross domestic product (GDP) growth recently at 3.4% (annual rate)...

by Jack FischerDuring LSEG Lipper’s fund-flows week that ended March 27, 2024, investors were overall net redeemers of fund assets (including both conventional funds and...
Are you sure you want to block %USER_NAME%?
By doing so, you and %USER_NAME% will not be able to see any of each other's Investing.com's posts.
%USER_NAME% was successfully added to your Block List
Since you’ve just unblocked this person, you must wait 48 hours before renewing the block.
I feel that this comment is:
Thank You!
Your report has been sent to our moderators for review



Add a Comment
We encourage you to use comments to engage with other users, share your perspective and ask questions of authors and each other. However, in order to maintain the high level of discourse we’ve all come to value and expect, please keep the following criteria in mind:
Enrich the conversation, don’t trash it.
Stay focused and on track. Only post material that’s relevant to the topic being discussed.
Be respectful. Even negative opinions can be framed positively and diplomatically. Avoid profanity, slander or personal attacks directed at an author or another user. Racism, sexism and other forms of discrimination will not be tolerated.
Perpetrators of spam or abuse will be deleted from the site and prohibited from future registration at Investing.com’s discretion.