
Technically Speaking For March 18
Summary
- Despite a large amount of political stress, EU ETFs have rallied since the first of the year.
- There are still a number of positive numbers for the US labor market.
- The indexes were modestly higher today. But, the market is waiting for the Fed announcement on Wednesday.
European political stress is high. The international soap opera that is Brexit continues. Although the number of participants is declining, the Yellow Vest protests continue in France. Italy is still considering participating in China's Belt Road Initiative. Finally, Ukraine is in the middle of an election where a newcomer is leading the polls. All of this is occurring against a backdrop of slowing growth (emphasis added):
Euro area real GDP increased by 0.2%, quarter on quarter, in the fourth quarter of 2018, following growth of 0.1% in the third quarter. Incoming data have continued to be weak, in particular in the manufacturing sector, reflecting the slowdown in external demand compounded by some country and sector-specific factors. The impact of these factors is turning out to be somewhat longer-lasting, which suggests that the near-term growth outlook will be weaker than previously anticipated. Looking ahead, the effect of these adverse factors is expected to unwind.
However, the major EU equity indexes have rebounded since the beginning of the year:
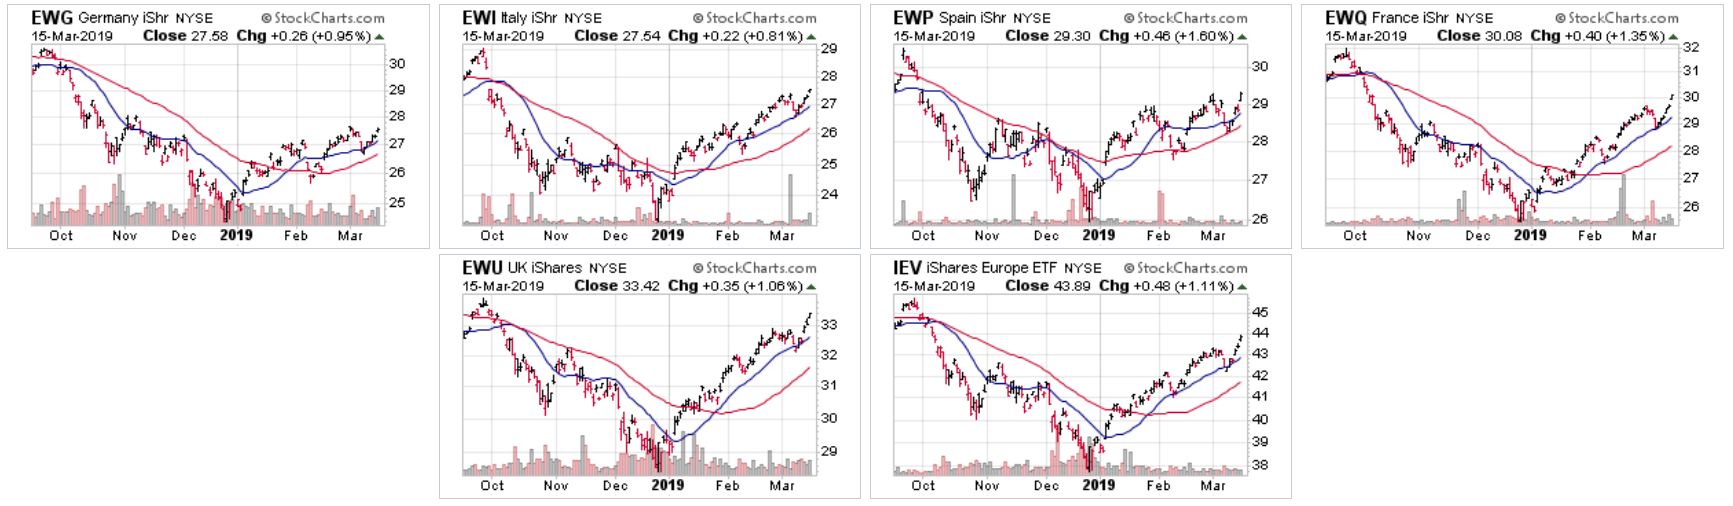 Equity indexes are leading indicators, which means they could be seeing something other analysts don't.
Despite a weak employment report, the U.S. labor market is still in very good shape. Consider these observations from Jared Bernstein (emphasis added):
The average over the past 3-months of 186K is a much more reliable take on the current underlying pace of job growth. Consider, for example, that payroll jobs were up 311K last month, a value well above trend. So, at least for now, consider this downside miss payback for last month’s huge upside.
The unemployment rate ticked down to 3.8 percent and not because people left the labor market (the participation rate was unchanged) but because the unemployed got jobs (employment rose 255,000 in this survey).
The story here is that after being stuck at 2.5 percent for a patch around 2017, the tighter job market began to deliver more bargaining power to wage earners, and firms have had to bid wages up, such that hourly pay is now rising about a point faster than it was back then.
Finally, there's this data from the JOLTs report:
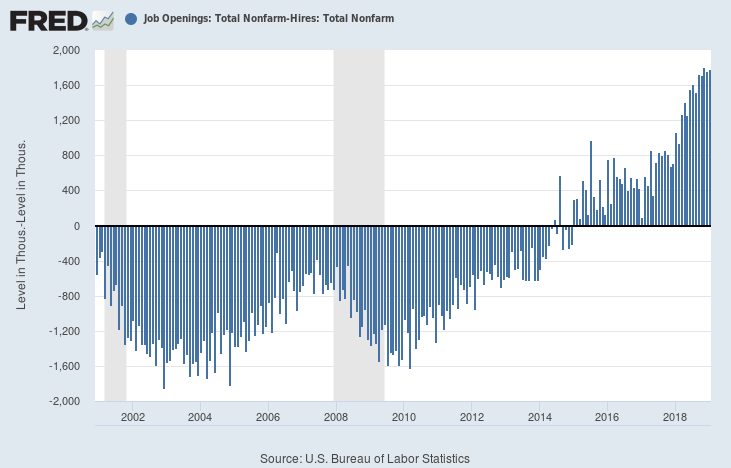
I've subtracted total hires from total openings. Even after hiring people, there are still a large number of job openings.
U.S. consumer sentiment rebounded:
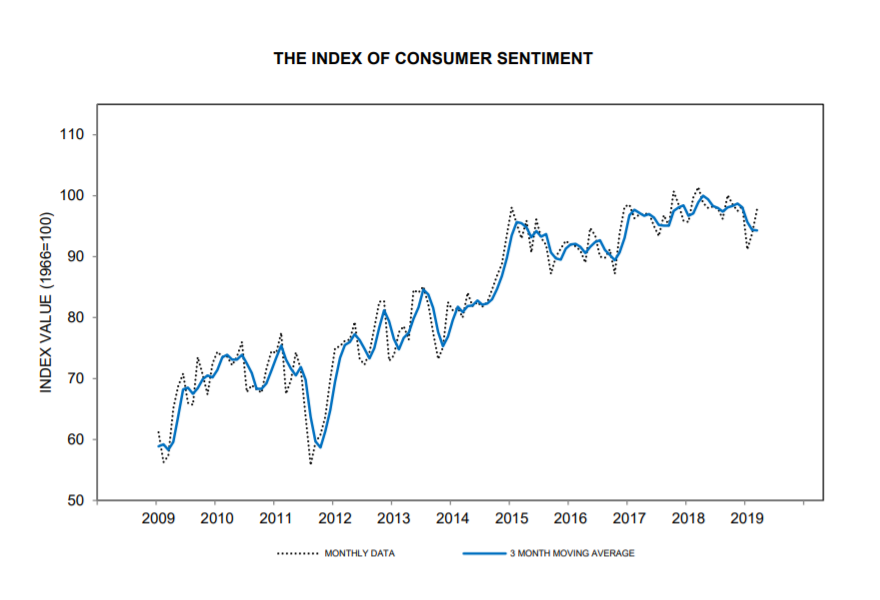
The last few retail sales numbers have been weak - but so has consumer sentiment. This is understandable with the large drop in the equity markets along with the government shutdown. With both of these situations resolved, we should see a rebound in consumer spending.
Today was a modestly decent day in the markets. The best news for the bulls is that the riskier indexes led the way higher: the transports gained .85%, the mid-caps rose .76%, and the small caps advanced .65%. Energy led the sectors higher thanks to OPEC and Russia announcing they'd stick to their production cuts. Financials were the second best performers due to the Deutsche Bank (DE:DBKGn) deal. Three defense sectors were at the bottom.
Remember that this is Fed week, which means that, barring any major economic or political news, we should expect modest movement until the Fed releases their statement.
Right now, we really have a tale of two markets, with a different picture for the large and small cap indexes. Let's start with the 5-day, QQQ chart:
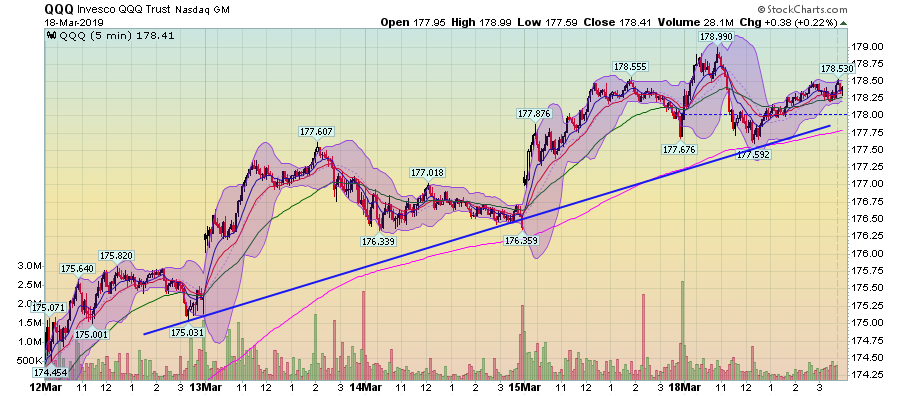
There's a nice solid uptrend in play with a clear trend of higher bottoms and tops.
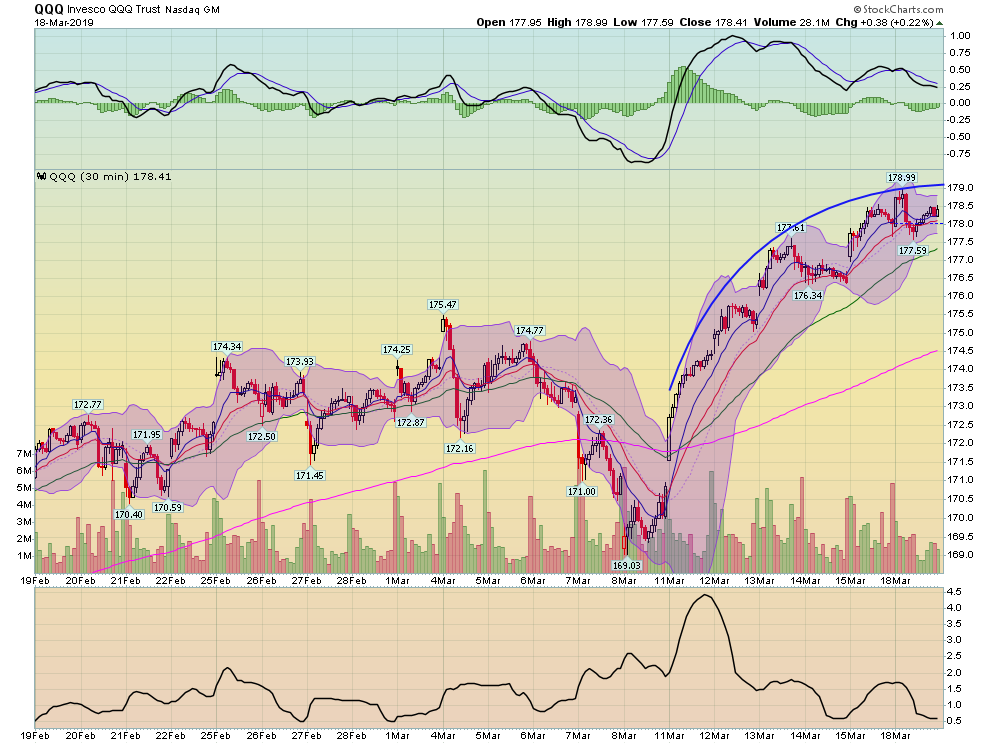
On the 30-day chart, prices are near a 30-day top. Prices forming a curving parabola, but that could also be a function of Fed week with traders in "wait and see" mode.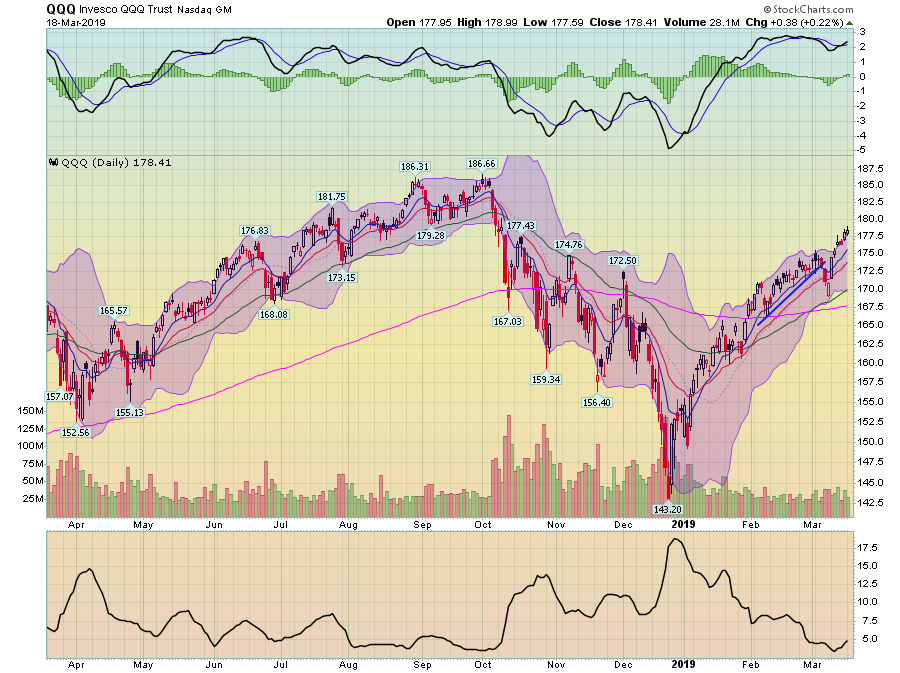
On the daily chart, the QQQ is in a clear uptrend.
And then we have the IWM:
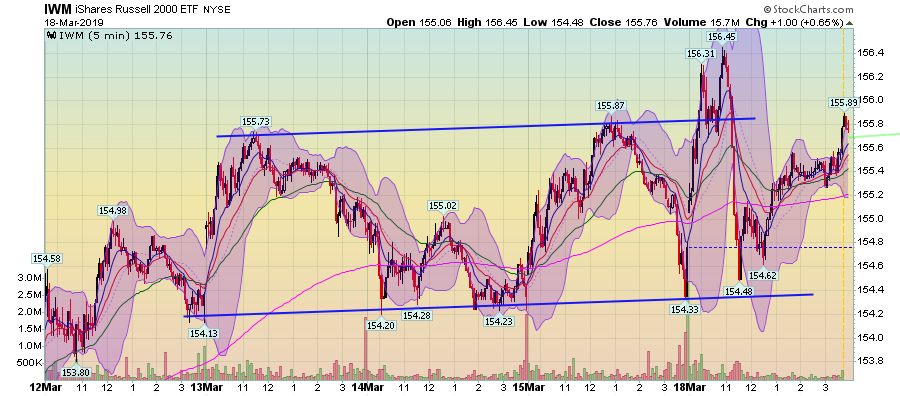
On the 5-day, 5-minute chart, prices are more or less trading sideways. Yes, they did spike above the 156 level this AM, but they quickly fell back to their trading range for the remainder of the trading session.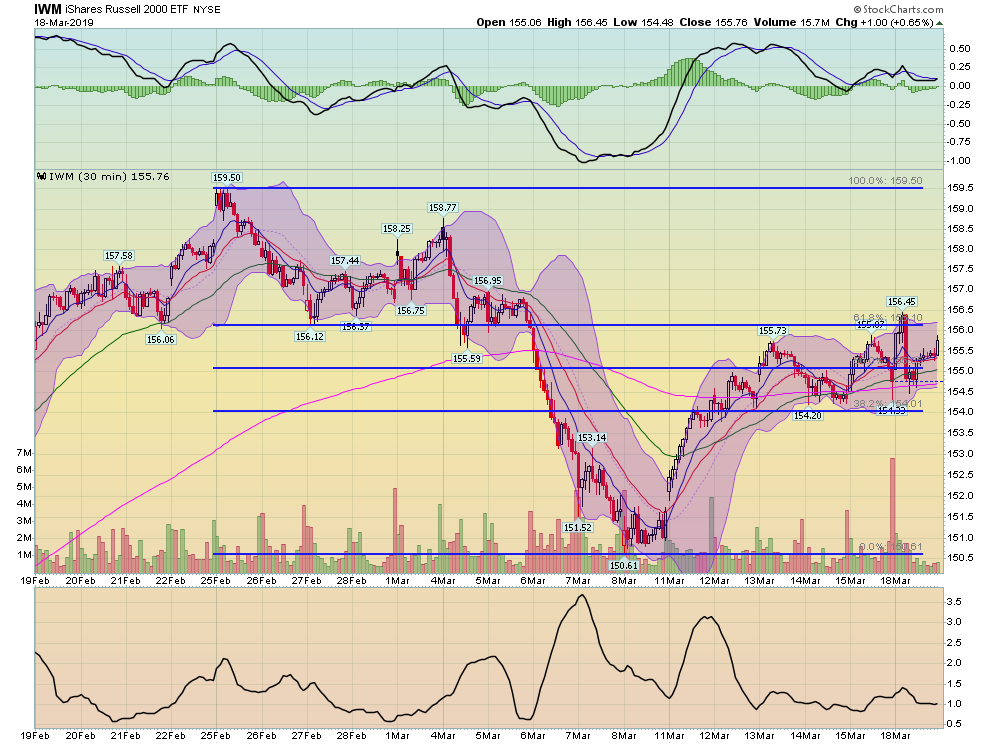
On the 30-day chart, prices are stuck in the mid-Fibonacci zone, right above the 200-minute EMA. Compare this to the QQQs, which have made new highs recently.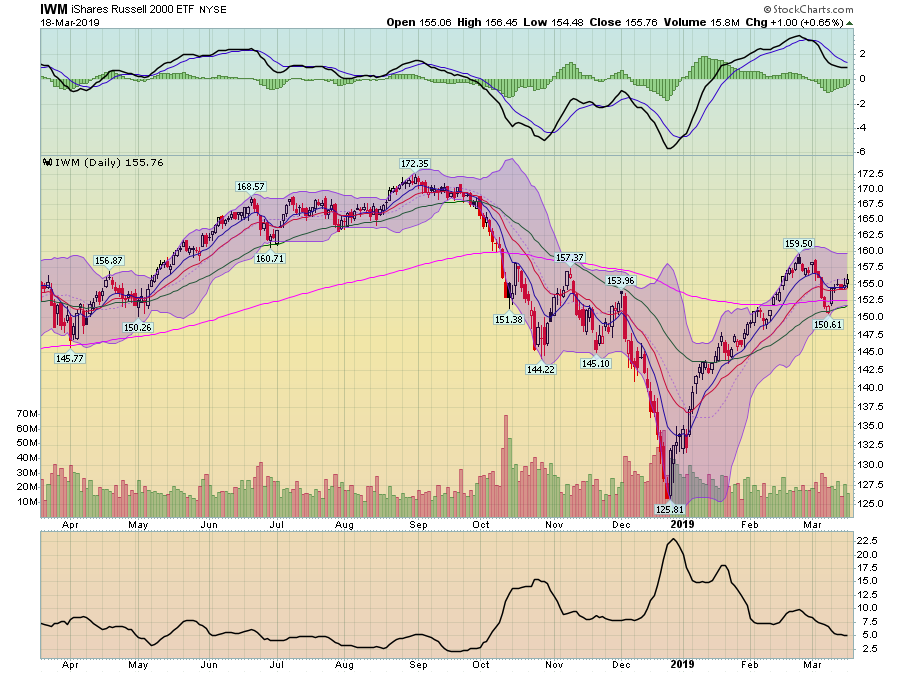
And on the daily chart, prices are still below highs from earlier in the year.
The good news for the SPYs is that today, prices printed a decent candle, which could mean the index is getting ready to move higher. That would be a welcome move, as its the IWMs under-performance relative to the SPY that has kept me from jumping onto this rally's bandwagon.
Disclosure: I/we have no positions in any stocks mentioned, and no plans to initiate any positions within the next 72 hours. I wrote this article myself, and it expresses my own opinions. I am not receiving compensation for it (other than from Seeking Alpha). I have no business relationship with any company whose stock is mentioned in this article.