Summary
- Regional manufacturing indexes are still positive but lower.
- Anecdotal comments from the latest Dallas Fed manufacturing report show more weakness related to trade issues.
- The equity ETFs are starting to breakdown across all asset sizes.
Regional Fed manufacturing indexes are still positive but weaker. This chart from Doug Short shows the trend (the emboldened black line is the average):
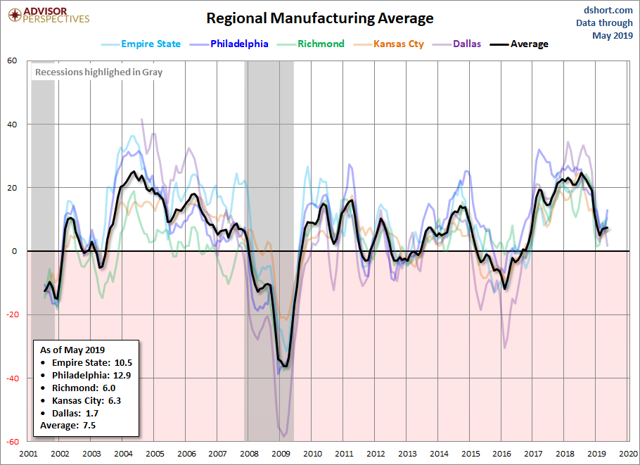
The latest Empire State report had a decline in new orders, employment, and the total workweek. The Philly Fed's index's current and future expectations were lower; the diffusion index (which measures the number of up and down indicators) was barely positive. The Richmond Fed's overall reading was up 2 points to 5; inventories were increasing and lead times were decreasing, indicating a higher level of slack in the system.
The latest Dallas manufacturing Index has a number of anecdotal comments showing tariffs hurting (emphasis added):
- China tariffs are a big drain on profits, so we are covering with a general price increase July 1.
- Uncertainty stifles hiring, expansion and capital expenditures. Threats of tariffs cause uncertainty.
- Tariffs simply increase our raw materials prices, which we pass on to our customers in the form of price increases on new projects.
- China tariffs are a big drain on profits, so we are covering with a general price increase July 1.
- The Chinese tariffs remain the wildcard, as it has started to take its toll on the electronics industry in which we are heavily involved.
- We are experiencing disruptions in our supply chain, some off them reportedly caused by tariffs on Chinese raw materials that have cascaded the disruption into materials we buy to manufacture some of our products (e.g., food grade pigments).
- Threats of new tariffs on trade with Mexico are causing uncertainty.
The Dallas Fed's district comprises the entire U.S.-Mexico border, so this report is catching all the negative news associated with the latest U.S.-Mexico tariff spat.
Liz Ann Sonders - the Chief Investment Strategist with Charles Schwab (NYSE:SCHW) - has one of the most interesting and useful Twitter feeds. Two recent tweets highlight key developments that haven't caught as much interest as they should: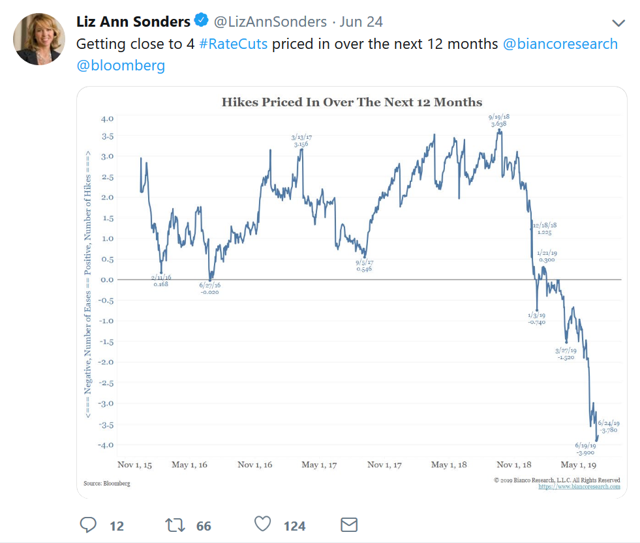
The market is betting on a very steep set of rate cuts, which means the bond market sees a lot more weakness than implied by the headline economic numbers.
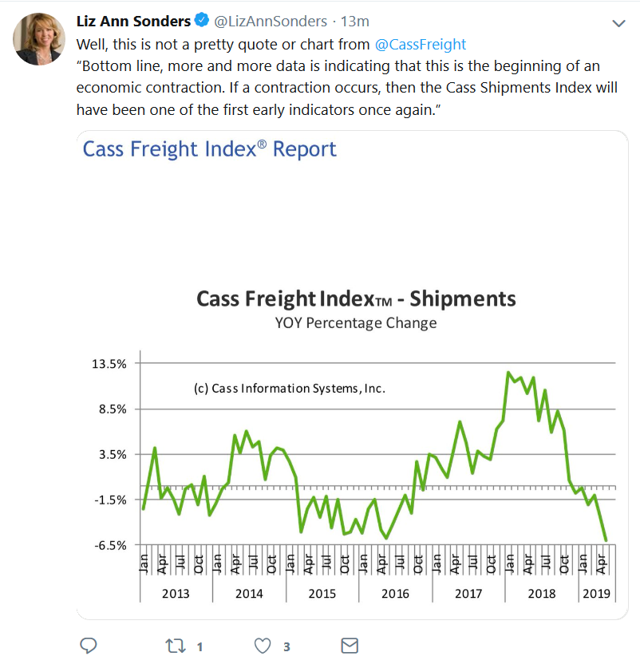
This correlates with the weak readings in the Transport Index during the Spring rally.
Let's turn to today's performance table:
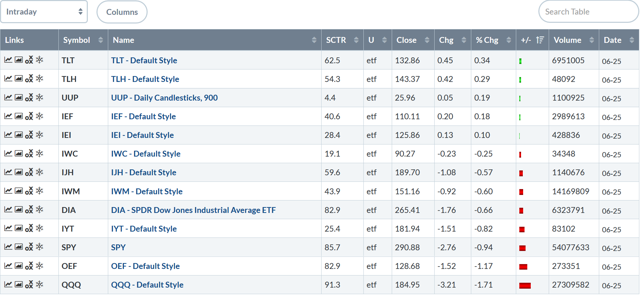
Another bearish day. The long-end of the curve had a modest rally. Small-caps were down modestly while the large-cap indexes had the largest declines.
The daily charts show that the indexes are starting to break-down across the size spectrum. Let's start with the micro-caps: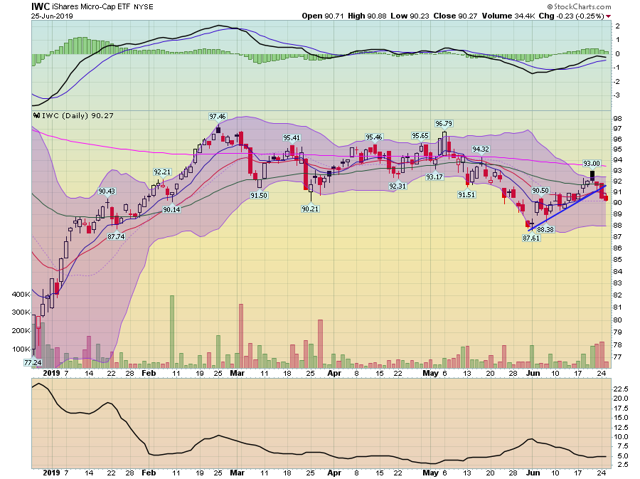
This index has yet to move through its 200-day EMA. Over the last few days, it's fallen through the shorter EMAs (which are still below the 200-day EMA) and its short-term trend line.
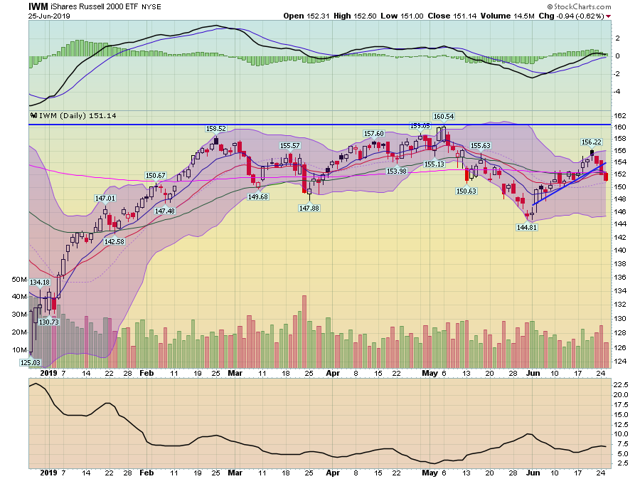
The (NYSE:IWM) was briefly above the 200-day EMA but has since fallen through the technical landmark. It hasn't moved above it's early May high. Prices are also below the short-term EMAs while breaking a short-term trend line yesterday.
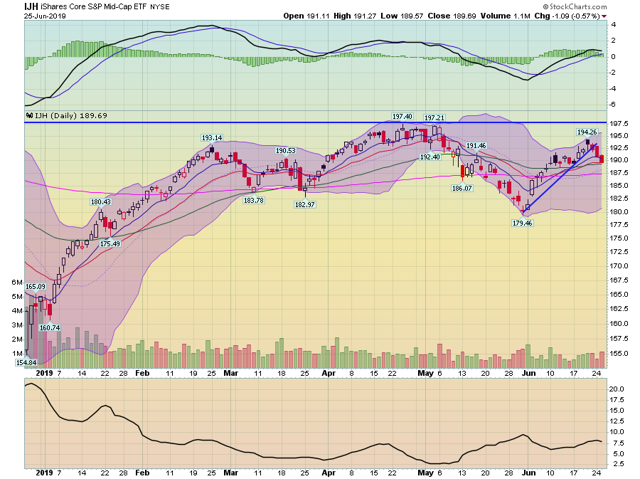
The mid-caps have yet to move above the highs from early May. Prices broke the short-term trend line yesterday.
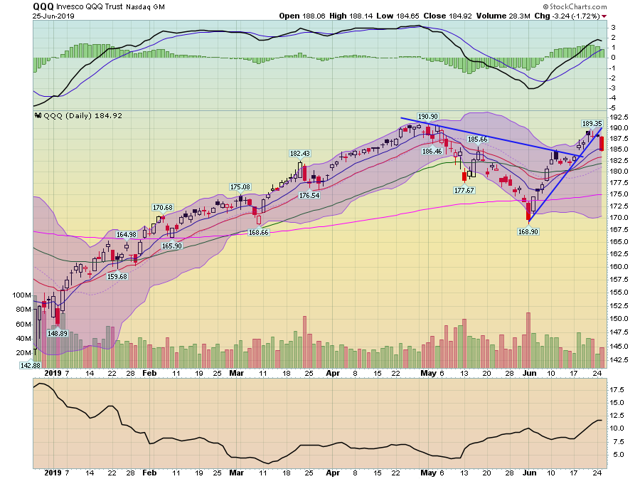
The QQQ (NASDAQ:QQQ) has yet to move above the the high from early May. Prices broke the short-term trend line earlier yesterday and are now moving lower. They remain above the short-term EMAs.
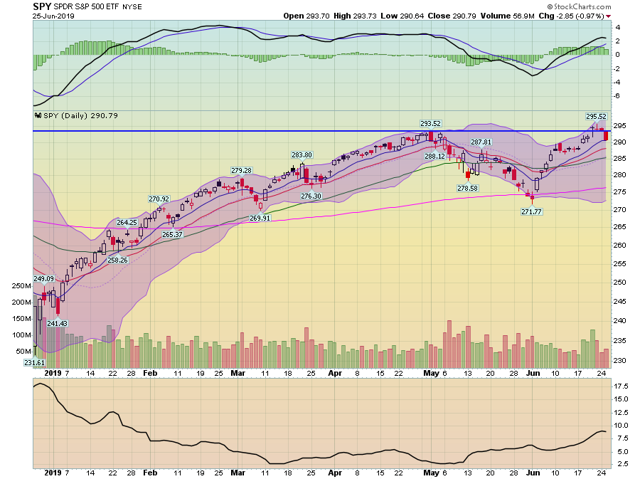
The SPY (NYSE:SPY) hit the previous high but stalled. Prices have now fallen through the 292 area and are heading lower.
Overall, the markets are now engaging in what I refer to as a "slow-motion roll-over." Prices have hit highs and are now slowly starting to sell off. It's doubtful we'll see a wave of panic selling; traders are convinced that the Fed is on their side. But, it certainly looks like the markets are in a selling mood.
