Technically Speaking For July 9
Summary
- Central banks aren't ready for the next recession.
- The BIS notes the economic weakness across the globe.
- The smaller-cap indexes have moved sustainably above 200-day EMAs.
Are central banks ready for the next recession? Probably not (emphasis added):
A recession is far from inevitable — particularly one as deep and painful as the last. But the capacity for the type of decisive response that prevented an even worse outcome in 2008 has been hindered. Back then, central banks cut rates, bought up bonds, extended government backing to financial products, lent money to banks and in some cases coordinated with government authorities to make sure their rescue packages didn’t work at cross-purposes. It was an unprecedented period of experimentation, one that saved economies careening toward collapse.
But today, interest rates remain below zero in Japan and Europe. They are low by historical standards in the United States, leaving less room to cut in a downturn. Most central banks still hold huge amounts of the bonds and other securities they bought to prop up their economies the last time, which could make another buying binge more difficult and dampen its effects.
Also consider that Japan has a debt/GDP ratio over 200% while the EU has budget rules that make it impossible to engage in a large fiscal stimulus in the event of a slowdown. While it's likely that the next recession will be mild (I'd expect a GDP contraction of, at most, 1%-1.5%), the inability of policy-makers to implement a meaningful policy response means regions could be mired in slow-growth for an extended period of time.
The recent global slowdown has been deeper than expected. The following is from the Bank of International Settlements:
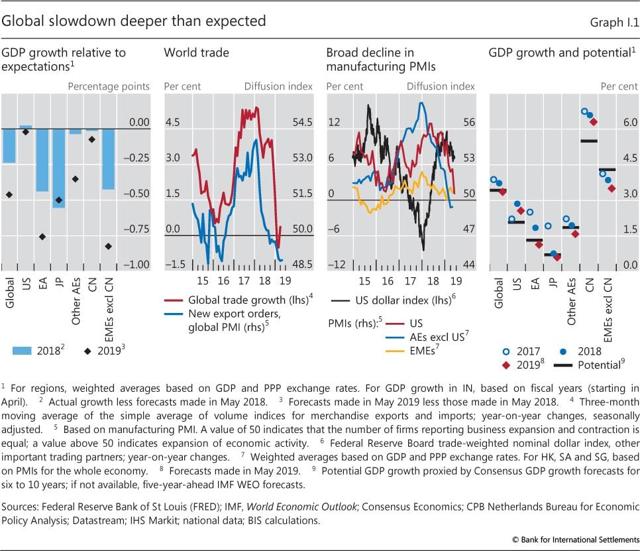
Note the second panel from the left which shows a sharp drop in global trade. Markit PMI reports from a number of regions have noted this trend for a number of months. The panel third from the left shows the drop we've seen in global PMIs for the last 6-9 months; the drop in trade data obviously had an impact.
The BIS report also argues that the following events caused the slowdown:
One such force was growing economic and political uncertainty and downside risks linked primarily to trade tensions and country-specific developments. Another, temporary force was the weakness in the global demand for electronics. Yet, a more important one was Chinese authorities' much-needed efforts to contain leverage and to pursue a structural rebalancing of the economy towards consumption-driven growth - efforts whose near-term effects on economic activity were compounded by rising trade-related concerns.
There is near-universal agreement that trade tensions are one of the primary causes of the slowdown. The Chinese government's efforts to deal with a large amount of leverage in their economy has impacted most of the ASEAN region. Japanese and South Korean exports are down while Australia recently cut rates to stimulate growth.
Let's turn to today's performance table:
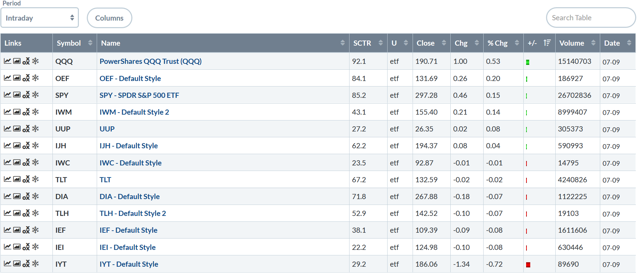
I feel very safe in stating that the summer doldrums have arrived. The QQQs were up a little more than 0.5%. But all the other averages were trading right around 0 - a wash.
Let's check in with the daily charts to see how the major indexes are doing. We'll use a small to large-cap order.
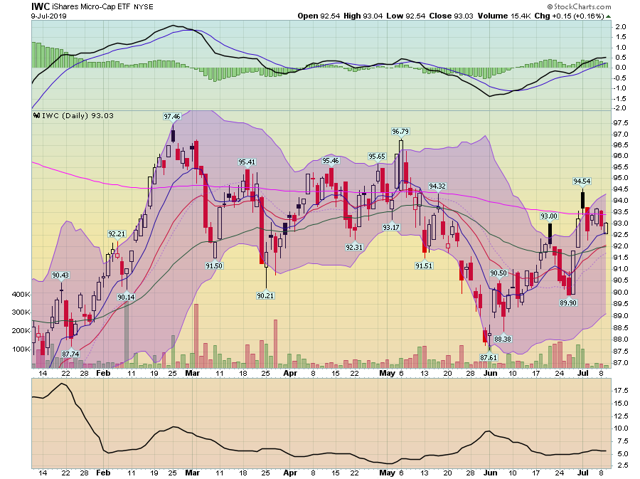
Although they are in an uptrend, micro-caps remain below the 200-day EMA. However, the MACD is rising - as are the shorter EMAs - indicating further gains might be ahead. Also, note that prices remain below highs from earlier in the year.
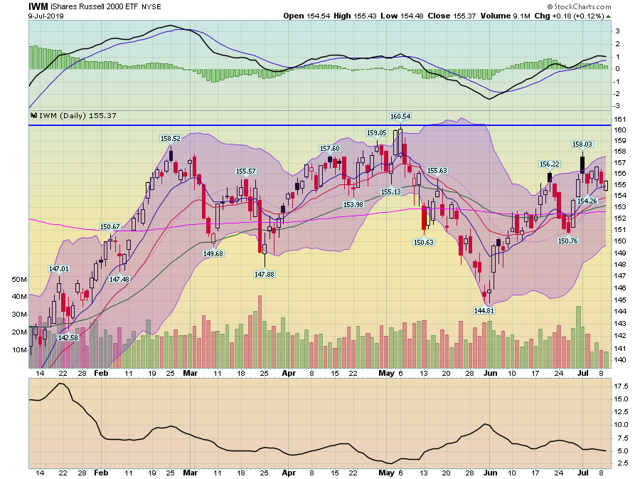
Small-caps have risen above the 200-day EMA as have the shorter EMAs. Momentum is rising but prices are still below previous highs.
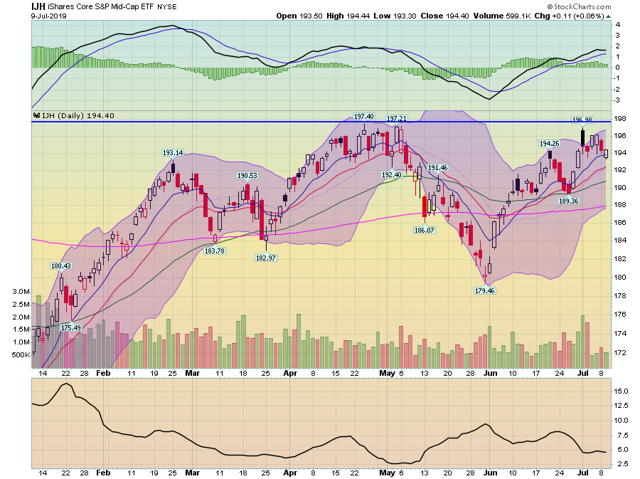
The mid-cap picture is progressively better - prices are now just shy of recent highs.
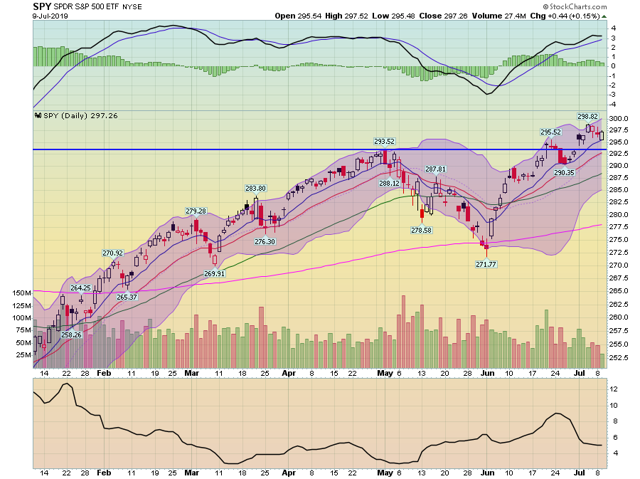
And finally, we have the SPY, which is above its previous high.
One of the small-cap averages has fulfilled one of my requirements for this rally to be "real" - it has moved sustainably above its respective 200-day EMAs. That's a positive development going forward.
