Technically Speaking For July 1
Summary
- The China-US trade talks are back on (for now).
- The latest PMI data from Markit is weak.
- Small-caps returned to their underperforming role today, once again bringing the rally into question.
US-China talks are back on:
A day after agreeing to resume trade talks with China, President Trump and his top advisers said no timeline existed for reaching a deal and suggested that the two sides remained as far apart as they were when talks broke up in May.
The truce reached at the Group of 20 summit in Osaka, Japan, over the weekend will forestall another round of punishing tariffs Mr. Trump had threatened to impose on nearly all Chinese imports. But it did little to resolve the Trump administration’s primary concerns, including its insistence that China agree to codify intellectual property protections and other changes in Chinese law.
While the markets will understandably cheer the news in the short-term, large problems remain. The biggest is the issue of technology transfer - the practice of China forcing companies to reveal key technical information in order to do business in China. The Trump administration wanted China to enshrine stronger IP protections into law, which the Chinese refused to do. After the last breakdown, news from China indicated they were going on a solid war-footing domestically, preparing for a long-term situation.
The latest ISM data was not encouraging:
- Asean PMI drops from 50.6-49.7, although two countries (Malaysia and Singapore) are responsible for the decline.
- Japan drops from 49.8-49.3; production and new orders were down, the former has declined for six months; export sales are down for seven months.
- China drops from 50.2-49.4; employment and sales both declined.
- EU increases from 47.4-47.6; Germany remains weak; new orders are down for nine months; exports are down for eight months; production id down for five months; employment contracted for a second month.
- UK dropped from 49.8-48; the overall reading has dropped for three months; production dropped the most since 10/12; export orders are down for three months.
Notice the breadth of the weakness - it's hitting all geographic areas.
The Institute for Supply Management released the latest Manufacturing PMI data. It inched lower to 51.7. New orders are right at 50 while production increased 2.8 points to 54.1. 12 out of 18 industries were expanding. The anecdotal comments were littered with complaints about the tariff situation. Here are a few examples:
- “China tariffs and pending Mexico tariffs are wreaking havoc with supply chains and costs. The situation is crazy, driving a huge amount of work [and] costs, as well as potential supply disruptions.” (Computer & Electronic Products)
- “Tariffs are causing an increase in cost of goods, meaning U.S. consumers are paying more for products.” (Chemical Products)
- “Tariffs continue to adversely impact decisions and forecasting. Our increasing fear is that current trends will weaken the global economy, influencing our ability to grow in 2020 and beyond.” (Fabricated Metal Products)
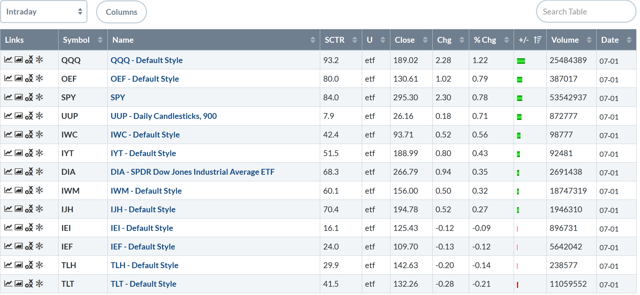
Let's turn to today's performance tables.

It was a good day for large-caps. The QQQs were up thanks to the relaxing of controls on Chinese tech companies. Other large-caps rose thanks to positive news on the trade front. Once again, small-caps have returned to their role of underperforming.
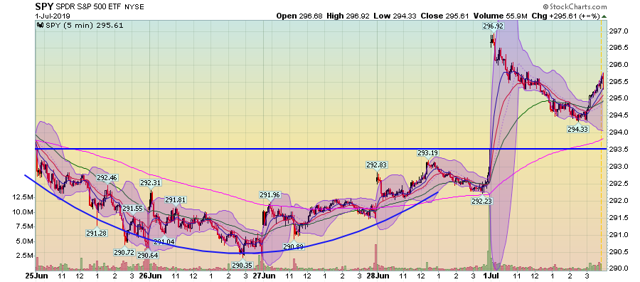
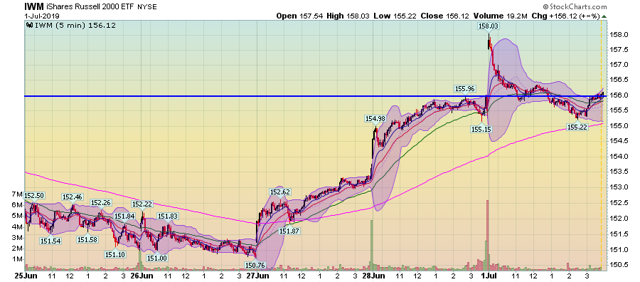
As I noted in my weekly market wrap, at the end of last week it appeared as though the small-caps were finally making a move higher. I also noted they needed to follow through on that rally. Today, that didn't happen. Let's compare the SPY and IWM charts.

The SPY gapped higher at the open. It trended lower for most of the trading session but caught a decent bid starting at 2 PM. However, prices remained above Friday's high for the entire trading session.
That is not the case with the IWMs. Prices gapped higher at the open but then fell at a far sharper rate They first crossed below Friday's high in the late morning and again in the early afternoon. They spent most of the remainder of the session below Friday's high until they rose to close just slightly above the 155.96 level.

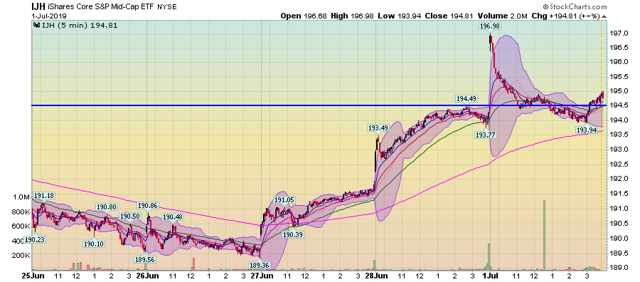
Mid-caps show a very similar pattern to the IWMs.
Overall, the small-cap underperformance shouldn't surprise us: if traders believe that the domestic economy is slowing (which is what the inverted yield curve means), then large-caps make more sense. But it also means that the large-cap rally isn't being confirmed by other averages, which continues to cast a negative light on the current rally.
