Summary
- Chinese data disappointed and probably shows that the mainland economy continues to transition from a developing to developed economy.
- The IMF has lowered their projections for 2019 growth.
- The markets sold off yesterday, but the daily chart is still in good shape.
Once again, concern about Chinese growth is dominating headlines. According to The National Bureau of Statistics, annual GDP growth was 6.4%. This is the slowest pace since sanctions were imposed after Tiananmen square in 1990. Industrial production was 5.7%. While this is .3% higher than October, this coincidental indicator started to weaken in 2015. Retail sales (another data set that is clearly moving lower over the 10-year time frame) were 8.2% M/M. As with all things economic, the analysis is mixed regarding the implications of these developments. My take is that we're witnessing the natural downshifting of economic growth as China transforms from a developing to a developed economy, which, if correct, has important and far-reaching implications for the global economy.
The IMF has lowered their projections for global economic growth in 2019 (emphasis added).
While global growth in 2018 remained close to post-crisis highs, the global expansion is weakening and at a rate that is somewhat faster than expected. This update of the World Economic Outlook (WEO) projects global growth at 3.5 percent in 2019 and 3.6 percent in 2020, 0.2 and 0.1 percentage point below last October’s projections.
The downward revisions are modest; however, we believe the risks to more significant downward corrections are rising. While financial markets in advanced economies appeared to be decoupled from trade tensions for much of 2018, the two have become intertwined more recently, tightening financial conditions and escalating the risks to global growth.
There are a number of developments supporting the World Bank's analysis:
- Chinese growth is slowing
- EU industrial production is weaker
- While mostly positive, global PMIs have moved lower
- The possibility of a hard Brexit is rising
- The US and China are still involved in trade brinkmanship
- U.S. growth is cooling
- The U.S. is in the middle of a budget impasse
- There's a fair amount of political risk in the EU (Italy, France, Poland)
I should caution that this does not mean a recession is imminent. But the risks are higher.
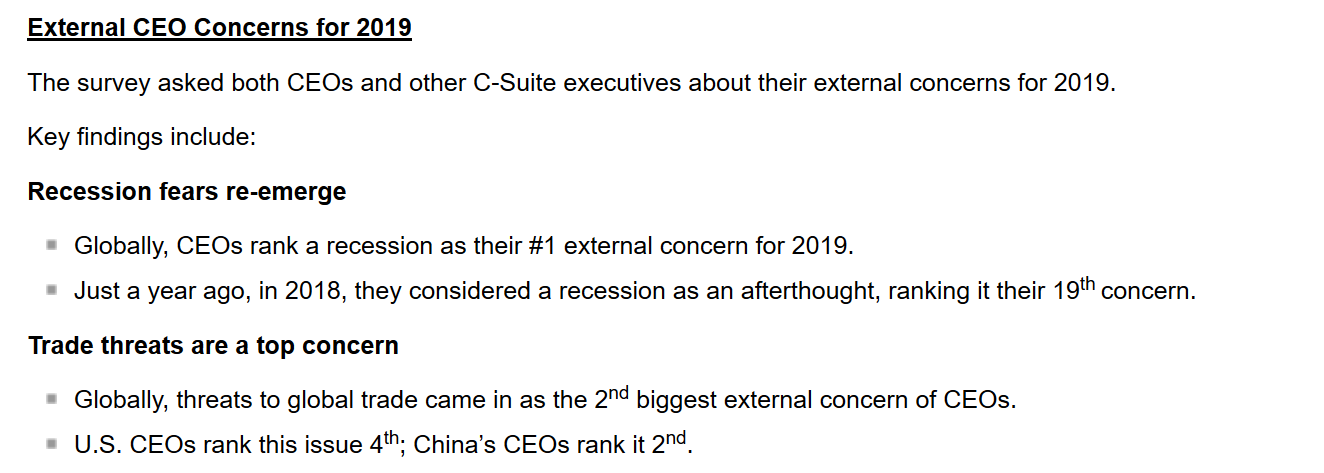
CEOs biggest concern for 2019 is a recession:
This will lower sentiment which will then decrease spending.
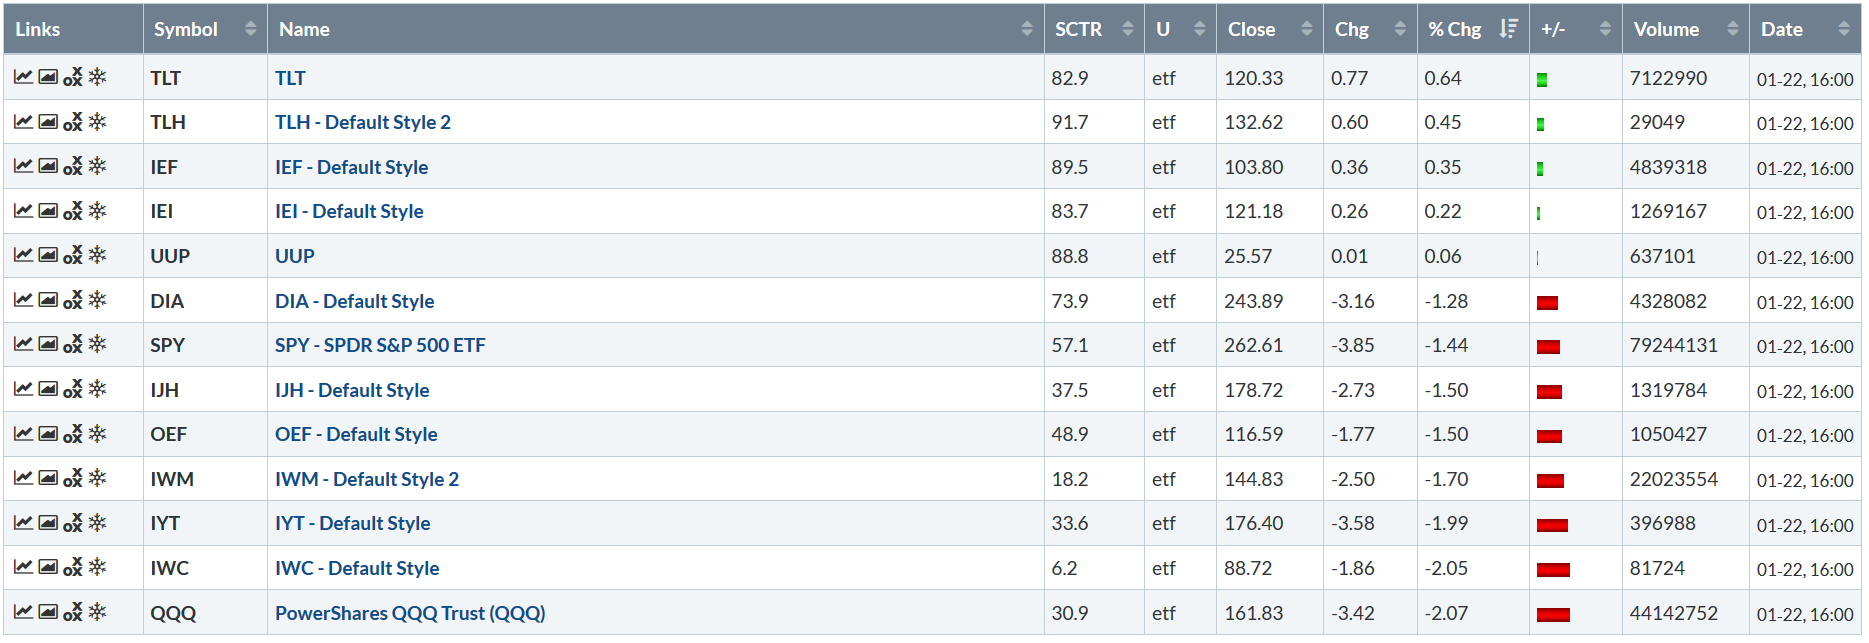
Let's turn to yesterday's performance table:
We're starting the week off on a down day, with the Invesco QQQ Trust Series 1 (QQQ) and iShares Russell 2000 (IWM) off slightly more than 2%. The best performer was the SPDR Dow Jones Industrial Average (DIA), and it was down 1.28%. This shouldn't be too surprising. The market has had a good run for the last few weeks; some kind of correction was bound to come.
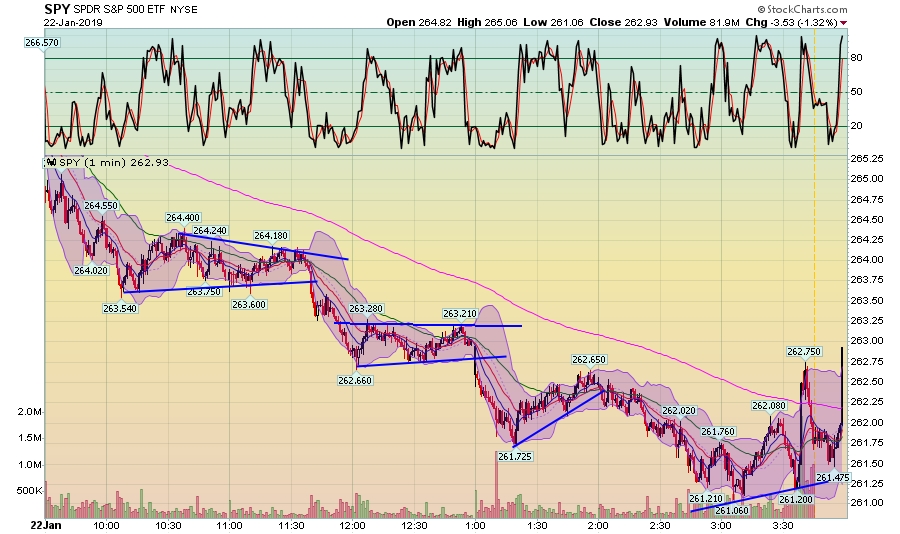
This was a strong selloff; the market moved lower all day. Prices consolidated losses at the 263.5, 262.6, 261.75, and 261 level. Notice the discipline of the selloff; consolidation occurred over a period of at least 45 minutes and in one case rallied modestly higher. But the 200-minute EMA tells the whole story: the index sold off for most of the trading session. 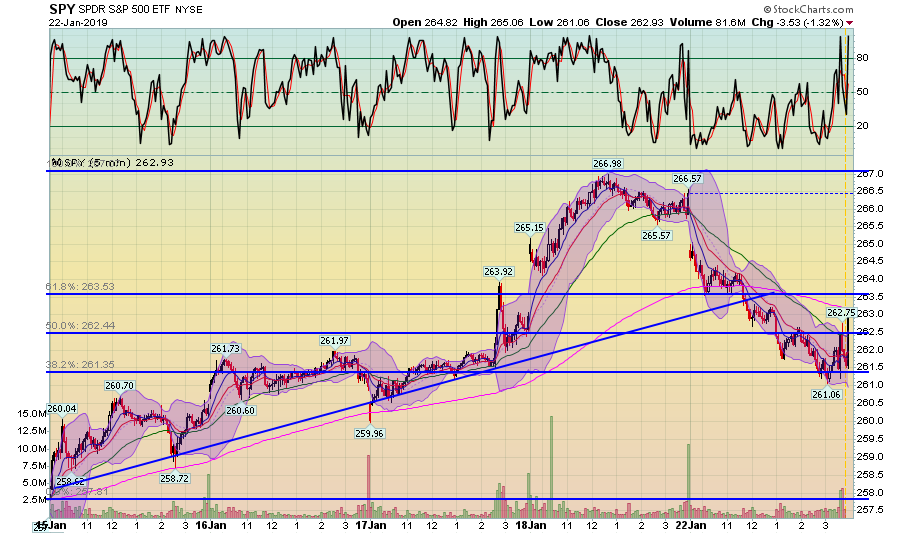
On the 5-day chart, prices broke a short uptrend connecting the lows from January 15, 16, and 17. Prices are coalescing around the 38.2% Fib level.
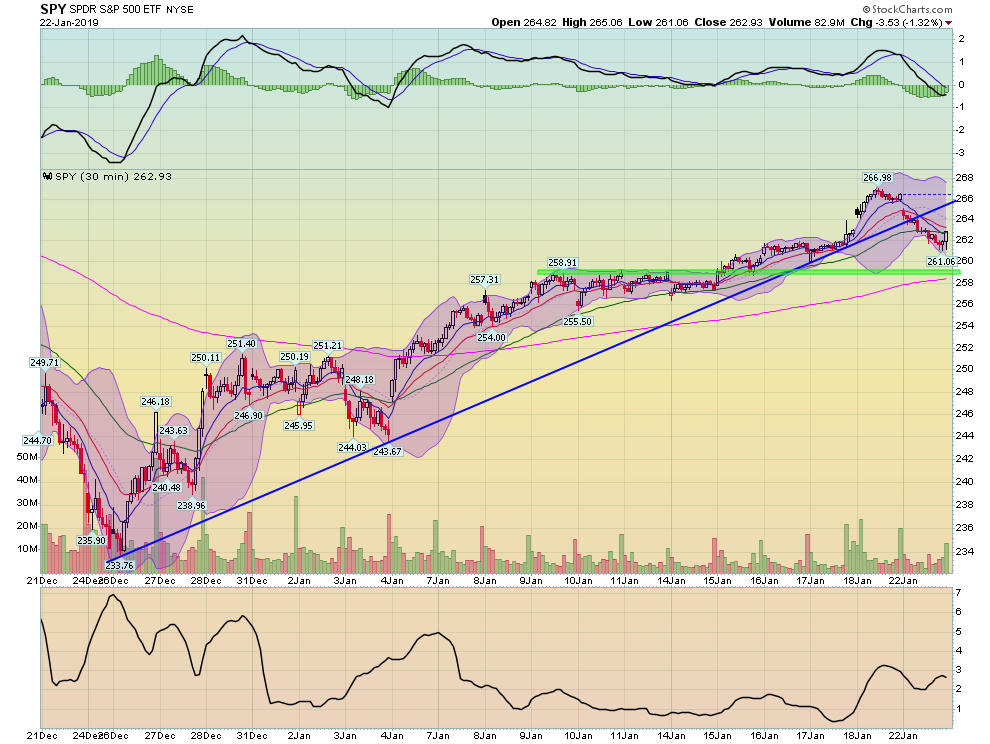
The 30-day chart places this into perspective. While prices have broken an uptrend, they are still above the 200-minute EMA and will probably try and find support at the 259 price level.
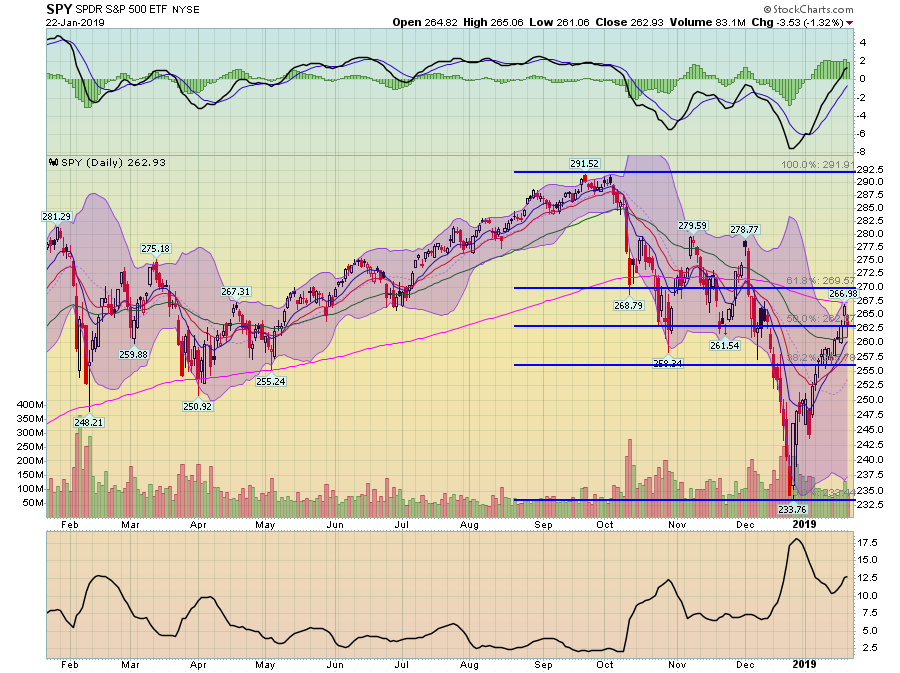
Prices hit resistance at the 200-day EMA and fell back to the 50% Fib level. Ideally, some consolidation of gains between the 50 and 200-day EMA would be appropriate before the index makes another run at the 200-day EMA.
Yes, the week started on a weak note. But, given the strength of the rally we've seen over the last few weeks, the selloff shouldn't be that concerning.
Disclosure: I/we have no positions in any stocks mentioned, and no plans to initiate any positions within the next 72 hours. I wrote this article myself, and it expresses my own opinions. I am not receiving compensation for it (other than from Seeking Alpha). I have no business relationship with any company whose stock is mentioned in this article.

