Technically Speaking For February 19
- EU officials are growing concerned about weak data.
- U.S. industrial production declined sharply in December.
- The markets were up modestly February 19.
ECB policy-makers are taking note of the weaker EU data (emphasis added):
The slowdown of the European economy is “significant” and the European Central Bank could change its interest-rates guidance if it becomes clear the situation isn’t temporary, Governing Council member Francois Villeroy de Galhau said.
The extent of the weakness at the end of 2018 has taken policy makers by surprise, with Italy entering recession and Germany narrowly avoiding the same fate. The ECB has so far stuck to its guidance that it will keep borrowing costs at record lows at least through the summer, indicating hikes could come after that.
ECB Board Member Peter Praet (emphasis added):
That is why we revised our assessment at the last meeting of the ECB's Governing Council in January. We see the constellation of risks surrounding the economic outlook, in other words the balance of risks, as tilted to the downside. That is a significant change in our communication and reflects concerns about the general economic situation. At the same time, however, we said that our baseline scenario has so far remained intact. In March we will have new macroeconomic projections from ECB staff and we will then re-examine our assessment.
This actually started about 6-9 months ago when the Markit Economic's PMI's started to decrease. The weaker GDP data from the larger economies have started to weaken overall GDP growth. Industrial production took a sharp dive in the latest report and sentiment continues to decline. I highlighted some of these trends in a January 14th piece titled, "It's Time to Worry About the EU."
Industrial production took a sharp dive in the latest report:
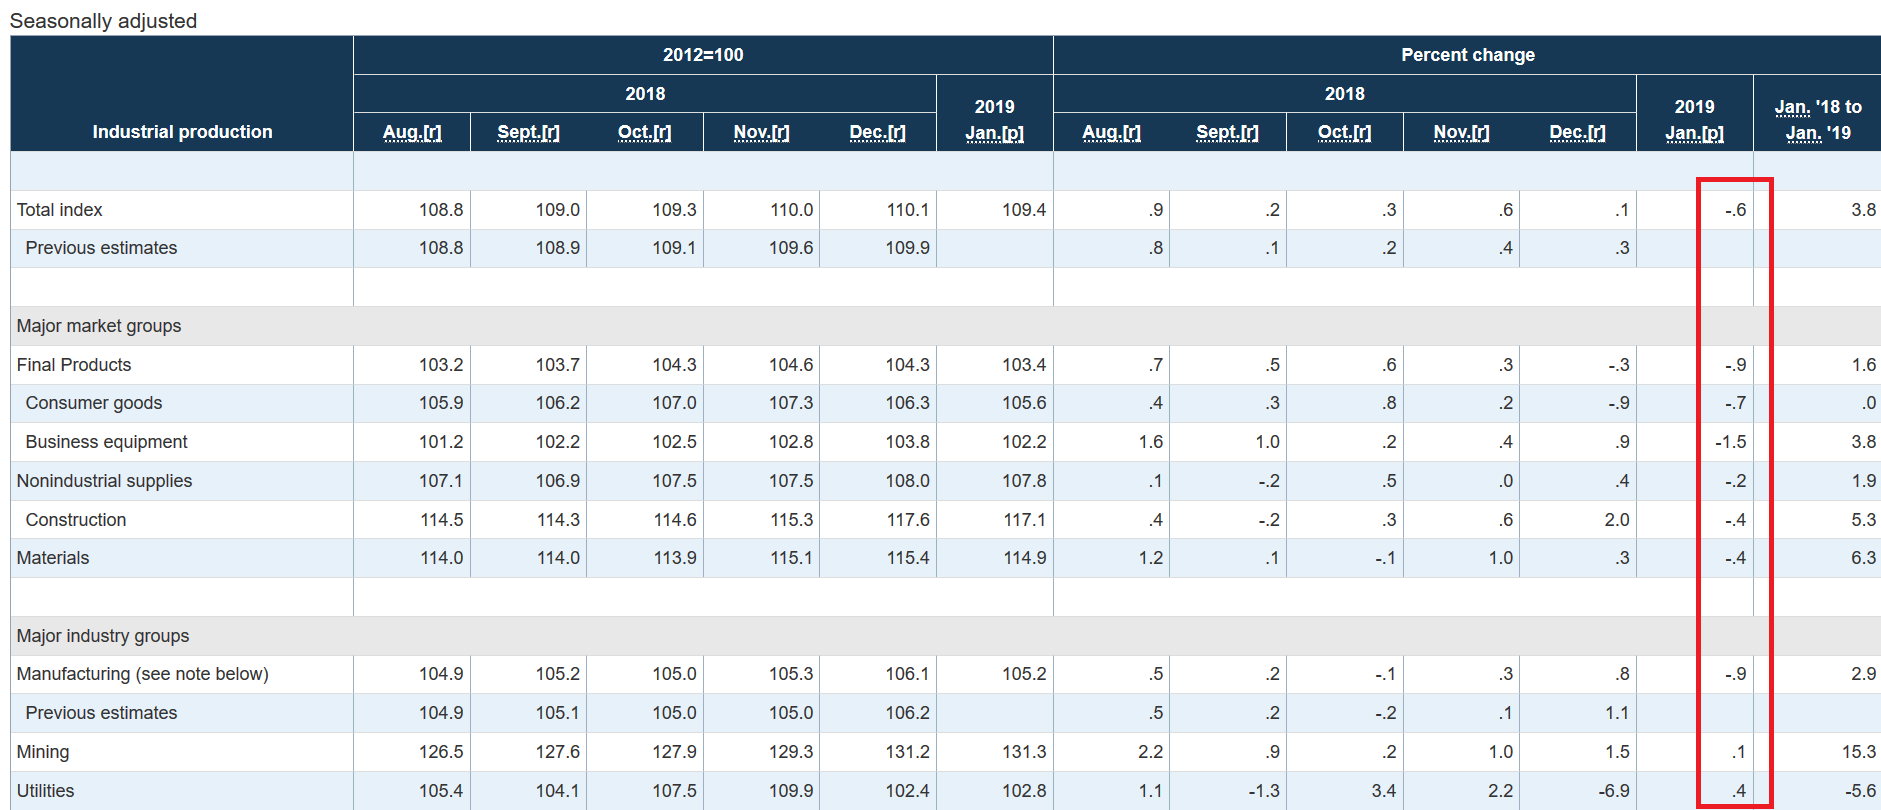
All the major market groups dropped - final products, nonindustrial supplies, and materials all declined, in some cases sharply. Most concerning was the .9% decline in manufacturing, which were caused be weaker auto production data (emphasis added):
The large drop in the output of motor vehicles and parts contributed significantly to sizable decreases posted by consumer durable goods, transit equipment, and durable materials. Results were mixed among other market groups, with many recording little change."
December was a bad month for financial data: the markets dropped, consumer sentiment swooned, and the U.S. started its longest government shutdown ever. It's possible these events hit sentiment which lowered activity. Nonetheless, when analyzed in conjunction with weak retail sales data, this data is concerning.
Brad Setser blogs over at the Council on Foreign Relations. He's a must read, as shown by his two most recent posts. First, he argues that it's past time for Germany to step up spending. Second, he argues that China's slowdown is actually more pronounced than we think. Both are well worth a read.
The markets were higher today, with the smaller caps leading the way. Micros rose .5% while the Russell 2000 (IWM) increased .3%. The treasury market gained between .2%-.26%. As for the sectors, basic materials (XLB) led the pack, gaining .62%. Two defensive sectors -- utilities (XLU) and staples (XLP) -- rounded out the top three spots, gaining .59% and .53 respectively.
Not all was perfect, however, as shown in the 1-day chart:
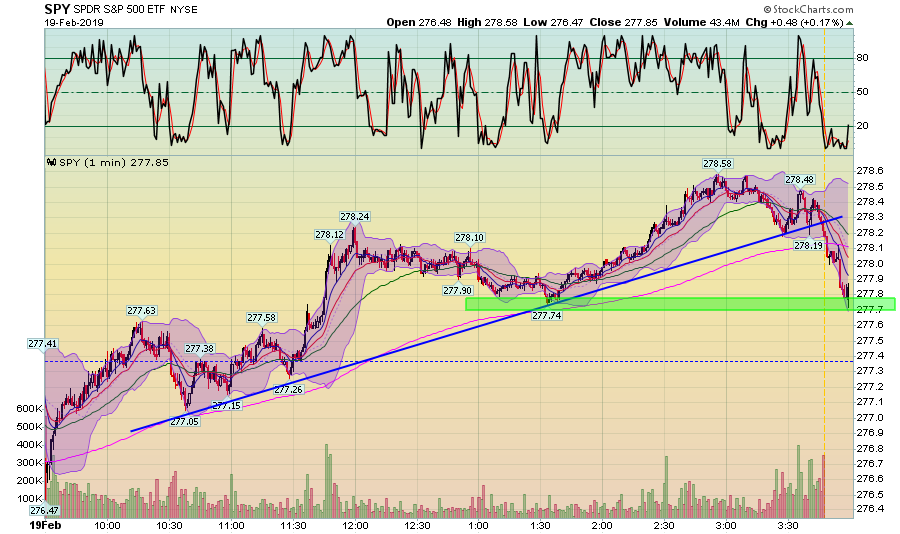
The SPY gapped lower at the open, then fell into a rally that lasted until the last half hour of trading. Then prices sold off on higher volume. End-of-the-day selloffs are never a good development; they indicate a level of skittishness about something.
However, the overall trends are still positive. Let's start with the SPY:
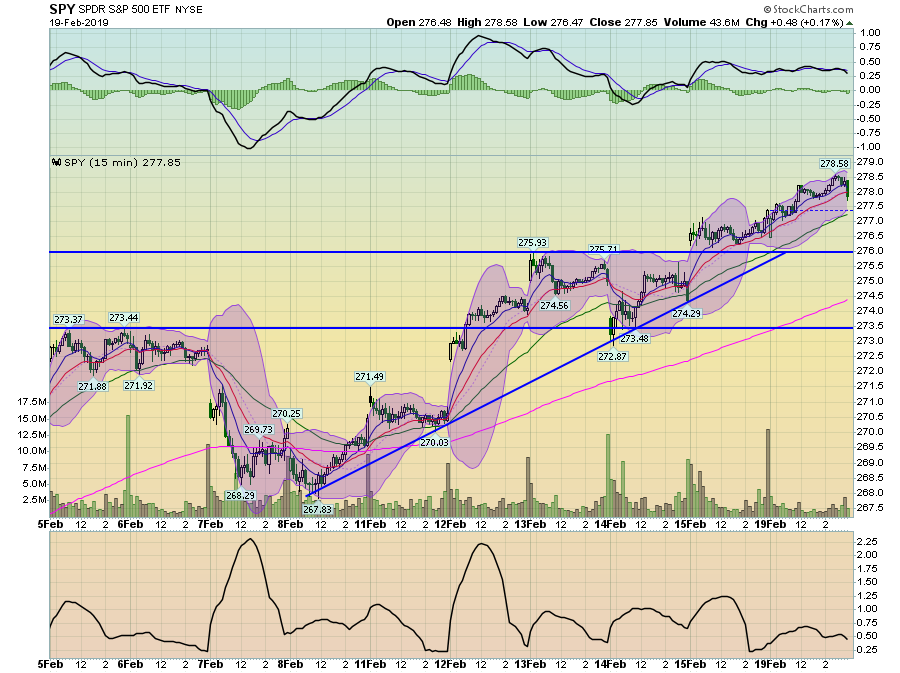
The SPY has been rallying since February 8. Prices have moved through 273.5 and 276, two key areas of resistance. The EMAs are rising with the shorter above the longer.
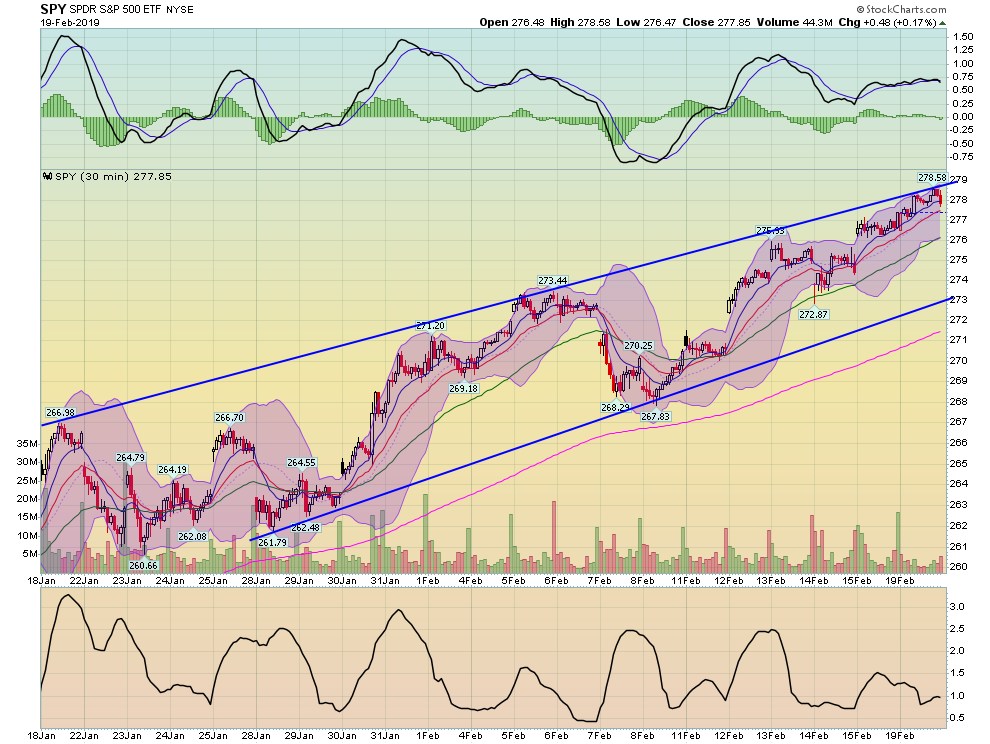
On the 30-day chart, the SPY remains in an upward sloping channel. Prices are currently hitting resistance at the upper trend line. Like the 20-day chart, EMAs are rising with the shorter above the longer.
The IWM is more bullish:
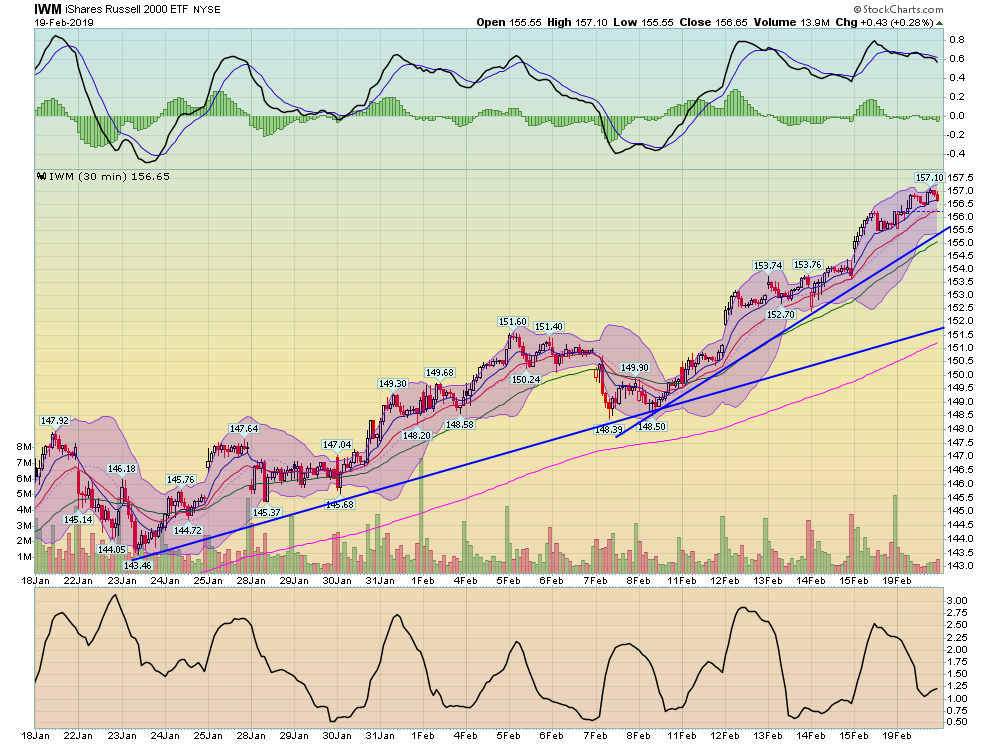
There are two trends on the 30-day chart. Prices rallied from January 23-February 8 then increased their slope between February 8 and today. The EMAs support the bullish analysis.
However, the QQQs are a bit weaker:
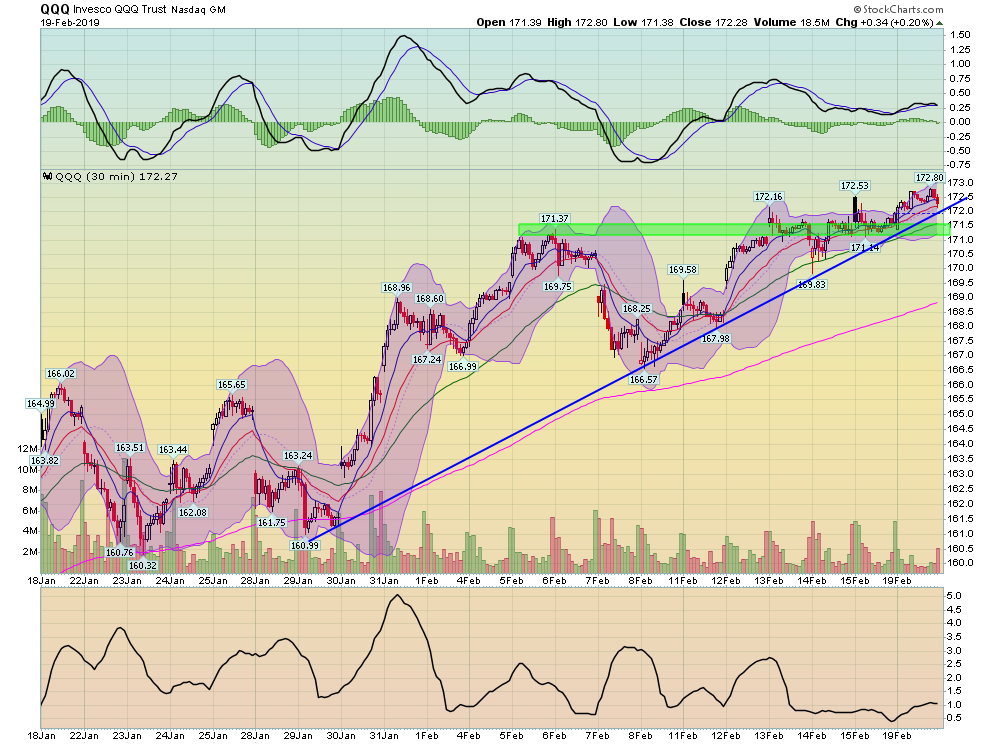
There's a general uptrend between January 23 and today. But prices hit a fair amount of resistance in the lower 170s. They spent four days trading around that level. They did move through it today, hopefully setting up further rallies. But the lack of a strong move through this level is a modest yellow flag.
There are two ETF movements of note.
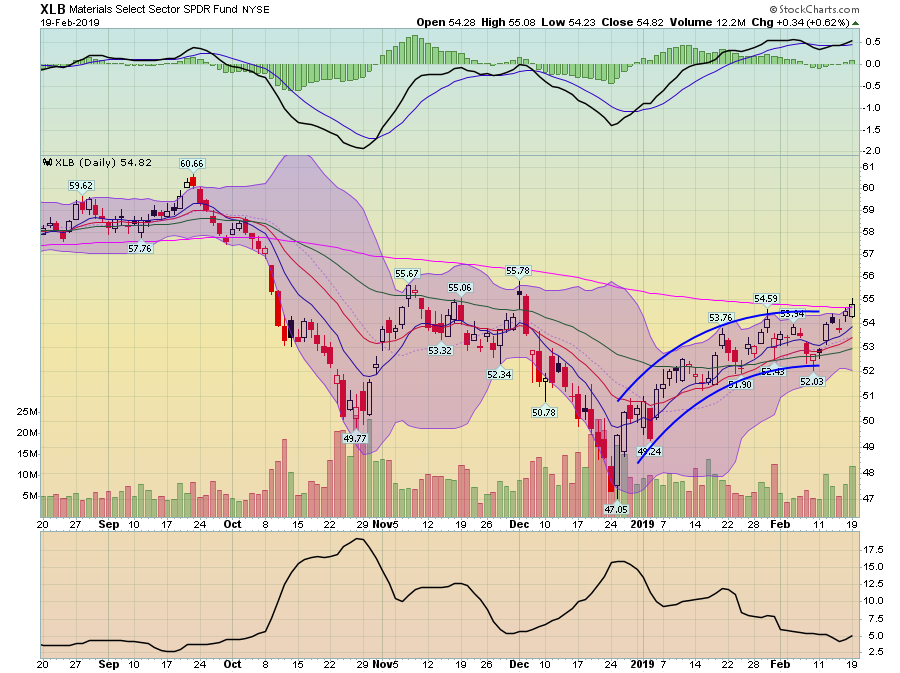
The basic materials sector is trying to move through the 200-day EMA. The MACD is caught in a "barbed wire" formation.
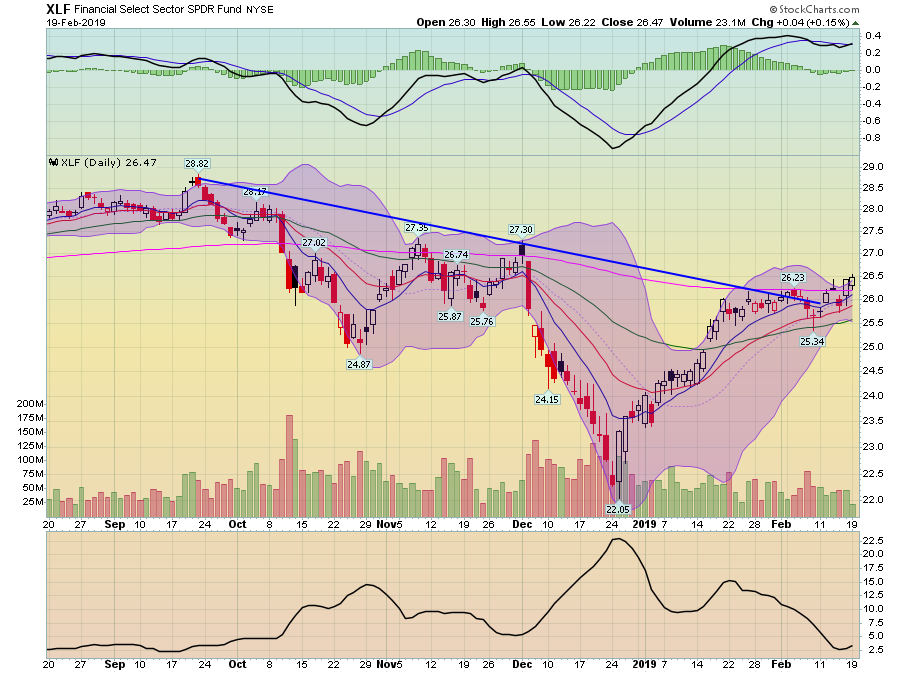
The financial services sector has moved through the 200-day EMA and trying to make an additional move higher. The MACD, however, hasn't given a solid buy signal yet.
Overall the market remains in solid shape with short-term upward sloping trends in place among the major averages.
Disclosure: I/we have no positions in any stocks mentioned, and no plans to initiate any positions within the next 72 hours. I wrote this article myself, and it expresses my own opinions. I am not receiving compensation for it (other than from Seeking Alpha). I have no business relationship with any company whose stock is mentioned in this article.
Original post
