
Summary
Britain is experiencing more Brexit uncertainty.
CPI is slightly above the Fed's 2% target.
The markets had a modest up day, but they're still in technically weak shape.
Short term treasury yields are now higher than the yield on the SPY (NYSE:SPY). 3-month T-Bill yields are around 2.4% while the SPY is yielding 1.9%. This creates additional momentum problems for the equity markets; the safety of short-term Treasuries are more likely to attract investors than the higher volatility of the SPY.
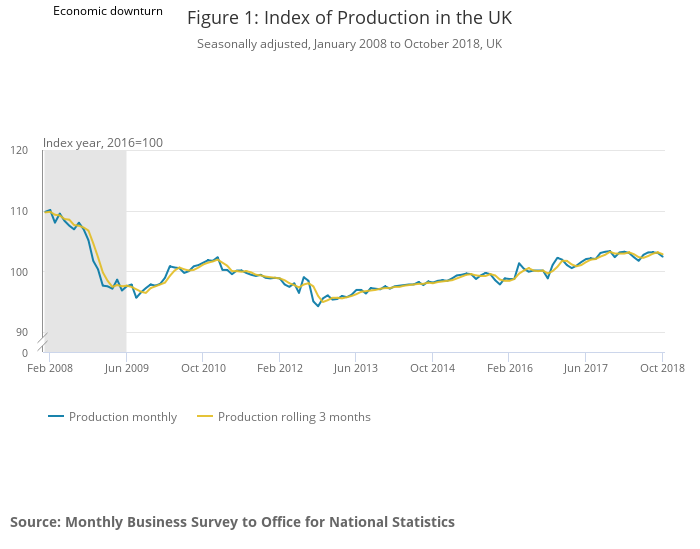
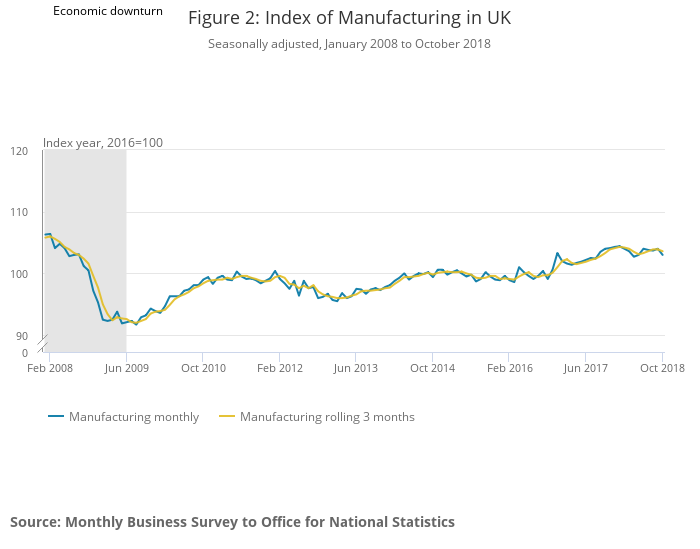
Teresa May, the UK Prime Minister, is facing a no confidence vote -- which she won. This shouldn't be surprising. The Brexit agreement she recently presented to Parliament was hated by Conservatives and Labour alike. The political uncertainty creates a huge problem: Brexit's hard date is March 29; conservatives won't vote on a new prime minister until late January. Despite the political drama, the UK economy continues to perform moderately well. According to data released by the ONS this week, the rolling three-month average GDP growth is .4% while the unemployment rate is 4.1%. However, production and manufacturing are weak: On a Y/Y basis, production growth was .1% while manufacturing grew .3%. The following charts from the latest report show that both have been treading water for the last year-and-a-half -- a time that roughly corresponds to major Brexit-negotiating headlines:
The BLS released its latest inflation estimate today [emphasis added]:
The Consumer Price Index for All Urban Consumers (CPI-U) was unchanged in November on a seasonally adjusted basis after rising 0.3 percent in October, the U.S. Bureau of Labor Statistics reported today. Over the last 12 months, the all items index increased 2.2 percent before seasonal adjustment.
Let's look at charts of the data, starting with CPI, the BLS' inflation measure:
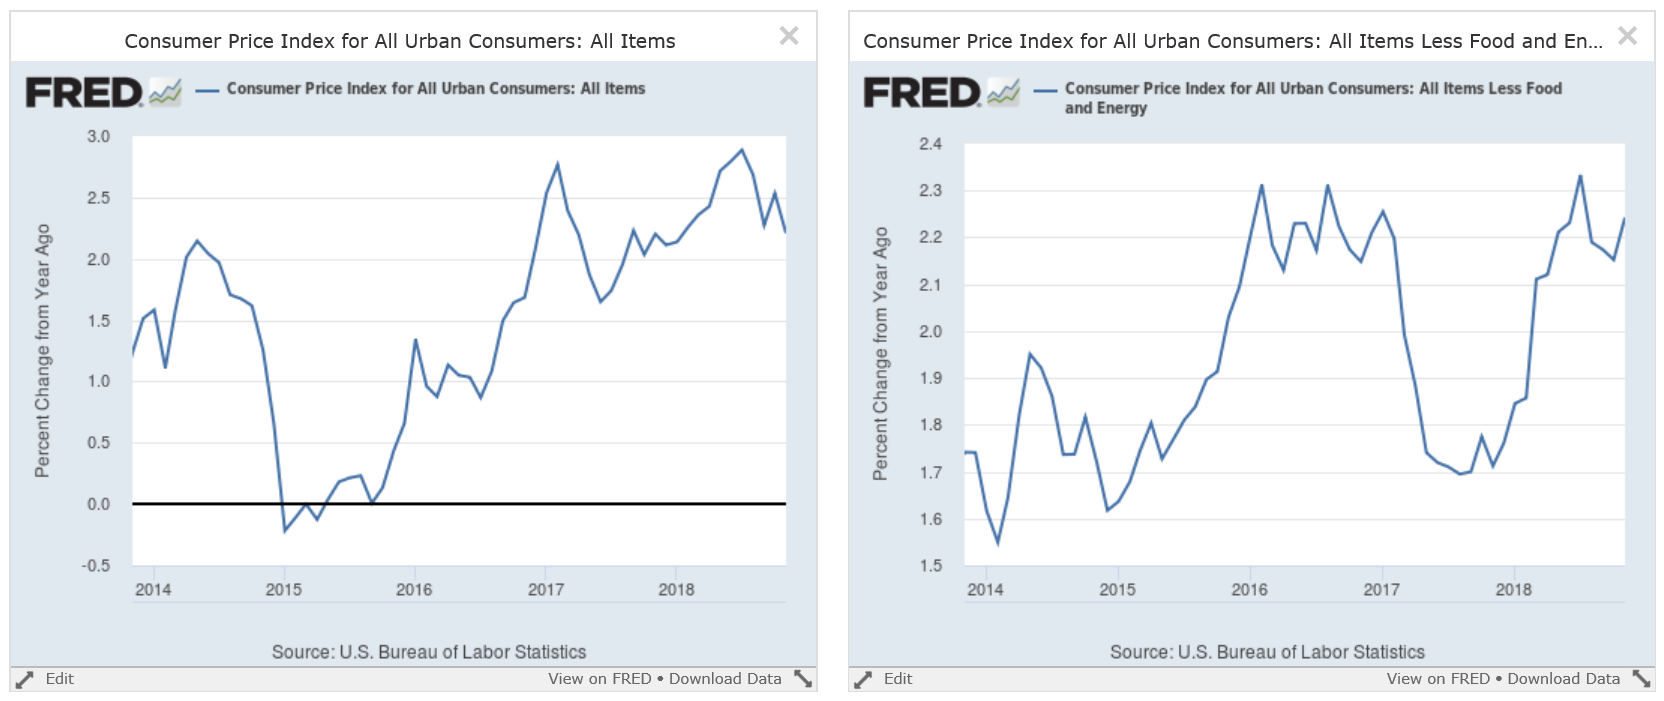
The left chart shows the Y/Y percentage change in the overall measure; the right chart shows the core measure. Both have been over the Fed's 2% target for some time. But this isn't the Fed's preferred price measure, which is the PCE price index (for more on the differences, see this piece from the BLS). Here are the Y/Y charts for the overall and core measure of the BEA's inflation measure: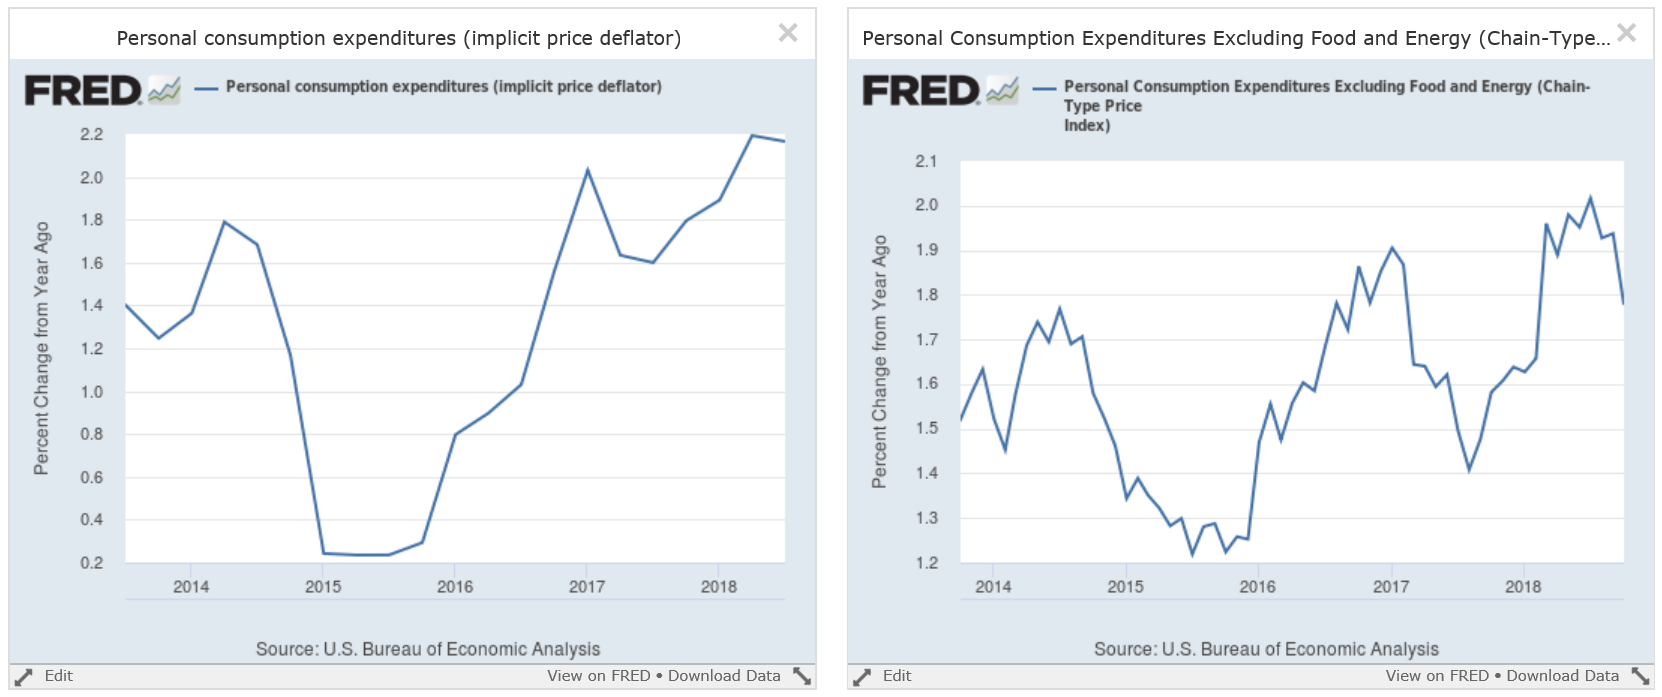
The overall measure is slightly above 2% while the core rate recently dipped back below 2%.
Remember that the Fed's 2% target is symmetrical: for example, if prices are below their target for an extended period of time (which occurred for a long time after the GFC), they can remain slightly above that level for an undetermined amount of time without warranting a rate increase. There's nothing in the above data that would force the Fed to raise rates.
Turning to the markets, here's today's performance table:
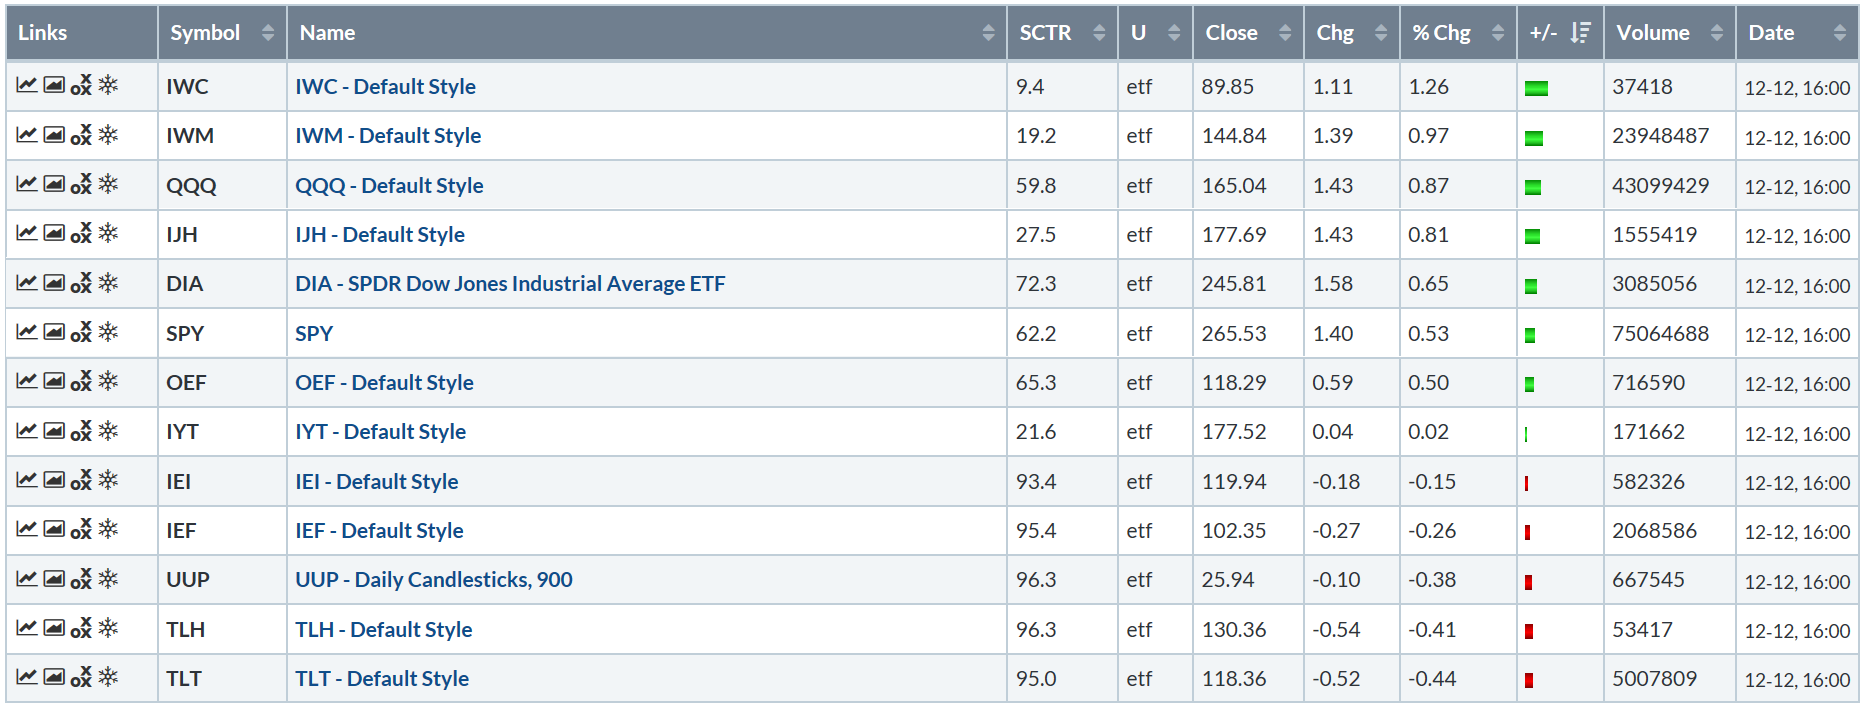
A decent day. Riskier indexes were the top performers with the micro-cap and Russell 2000 leading the way. Tech's advance helped to move the Invesco QQQ Trust Series 1 (NASDAQ:QQQ) higher. Mid-caps were next, followed by the stodgier indexes. Treasuries were off modestly, down as a result of tame inflation numbers.
Here is the performance table for the major industry groups:
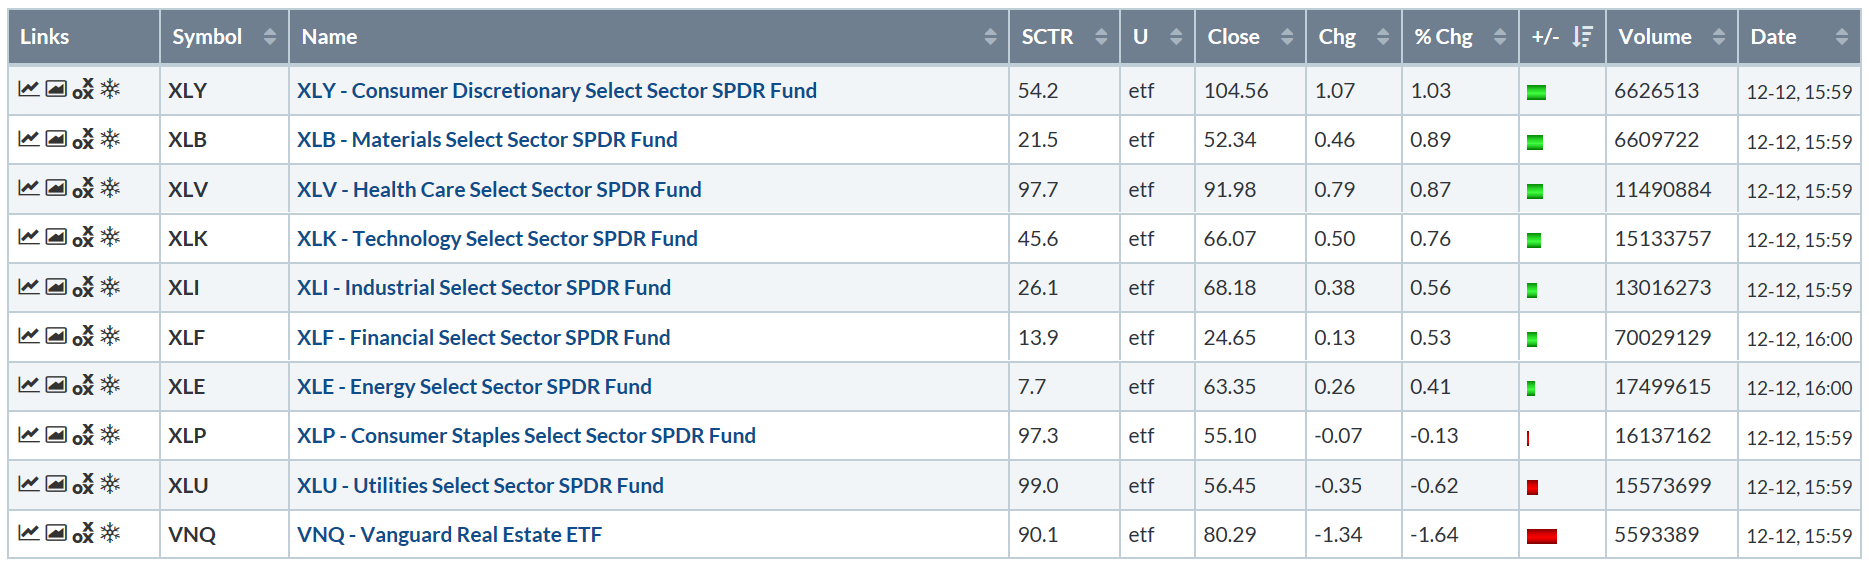
The main interest-rate sensitive industries (utilities and real estate) were down, as was consumer staples. At the top, we have discretionary, which rose in anticipation of a solid retail sales season, followed by basic materials and healthcare. But despite the better performance of the more aggressive sectors, defensive sectors are still outperforming over the last 10-weeks: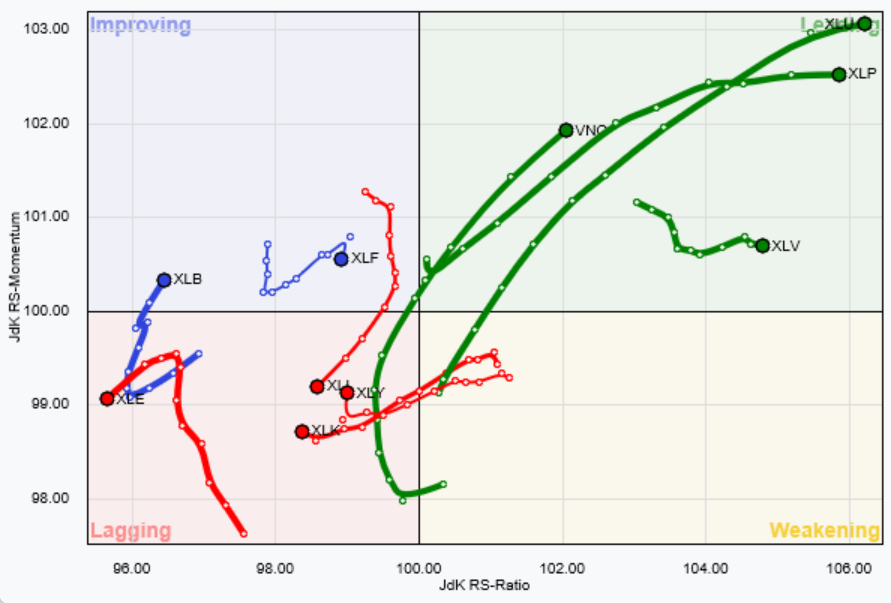
Turning to the charts, it's really the daily chart that shows the somewhat precarious nature of the markets right now:
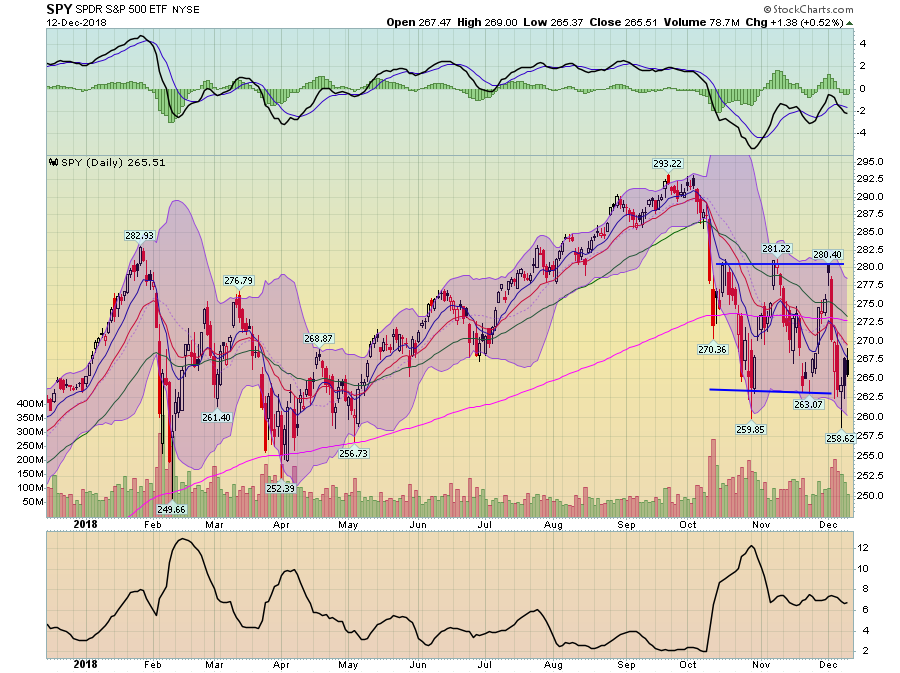
Prices are consolidating, moving sideways between the lower 260s and lower 280s. But underneath, there's technical degradation. The shorter EMAs are all moving lower with the 10, and 20-day EMA below the 200. The 50 will cross below soon. Momentum is rising but it's still negative. And volatility remains high -- which is concerning with prices once again hovering at the lower boundary of the indexes recent trading range.
It's beginning to look more and more like the market are going to end the year limping rather than rallying.
Disclosure: I/we have no positions in any stocks mentioned, and no plans to initiate any positions within the next 72 hours. I wrote this article myself, and it expresses my own opinions. I am not receiving compensation for it (other than from Seeking Alpha). I have no business relationship with any company whose stock is mentioned in this article.