Technically Speaking For April 22
Summary
- The U.S. labor force and the economy is increasingly bi-furcated.
- The U.S. will stop issuing waivers for Iranian oil exports.
- The overall picture of the markets remains constrained.
Automation is "splitting the US labor force in two":
Automation is splitting the American labor force into two worlds. There is a small island of highly educated professionals making good wages at corporations like Intel (NASDAQ:INTC) or Boeing (NYSE:BA), which reap hundreds of thousands of dollars in profit per employee. That island sits in the middle of a sea of less educated workers who are stuck at businesses like hotels, restaurants and nursing homes that generate much smaller profits per employee and stay viable primarily by keeping wages low.
There was a recent report that made the same observation but which included geographic data that showed large, urban areas were the primary source of growth while smaller cities and rural areas are being left behind. This report contributes to a growing body of data that shows a significant bifurcation of economic growth.
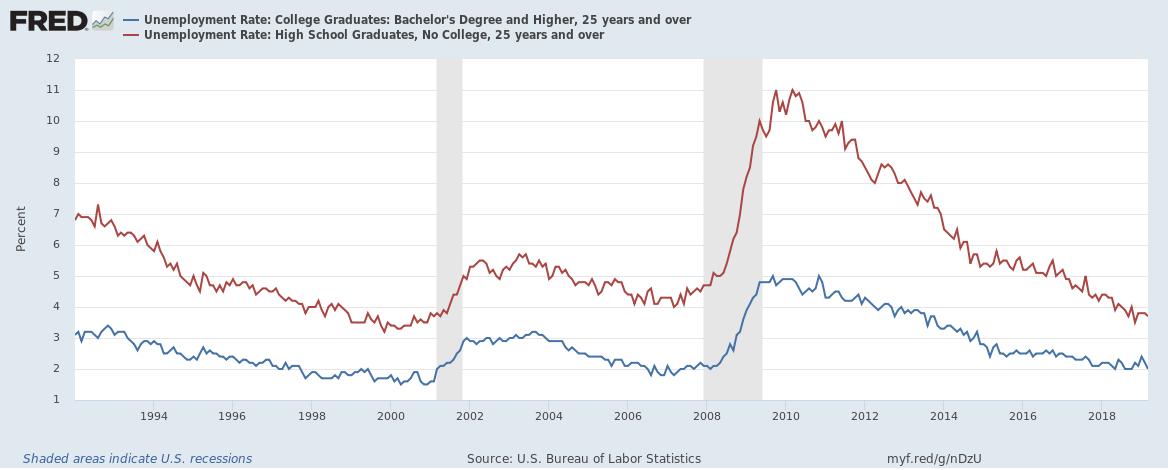
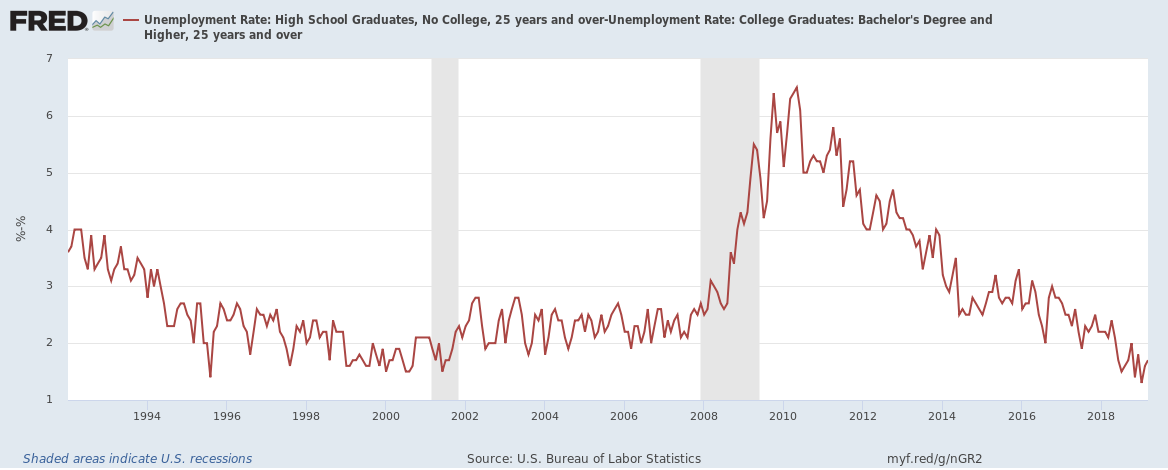
In light of the above-referenced story, consider the two sets of data that follow:
The top graph shows 25 years of data on the unemployment rate for college (in blue) and high school (in red) graduates while the bottom graph shows the difference between the two. At the height of the last recession, college graduates unemployment rate was only 5% while high school graduates rate was 11% - over twice the rate. And even in the best of times, the difference between the two is about 2%.
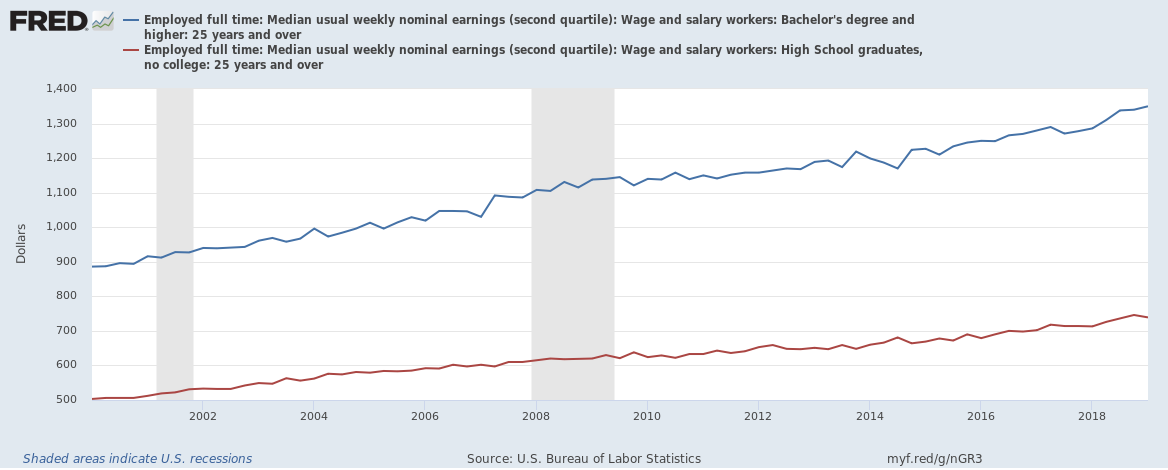
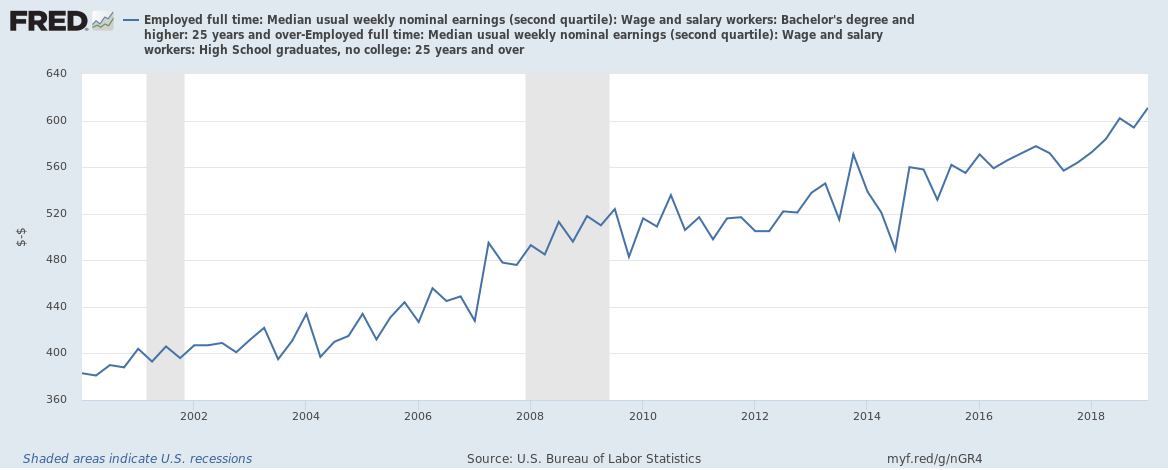
The earnings picture is similar:
The top graph shows the "usual weekly median pay" of the two groups (once again, blue is college, red is high school only), while the bottom chart shows the difference. The data is nominal (however, we are in very low inflation environment).
The U.S. is not renewing Iranian oil sanction waivers:
The Trump administration is poised Monday to tell five nations, including allies Japan, South Korea and Turkey, that they will no longer be exempt from U.S. sanctions if they continue to import oil from Iran.
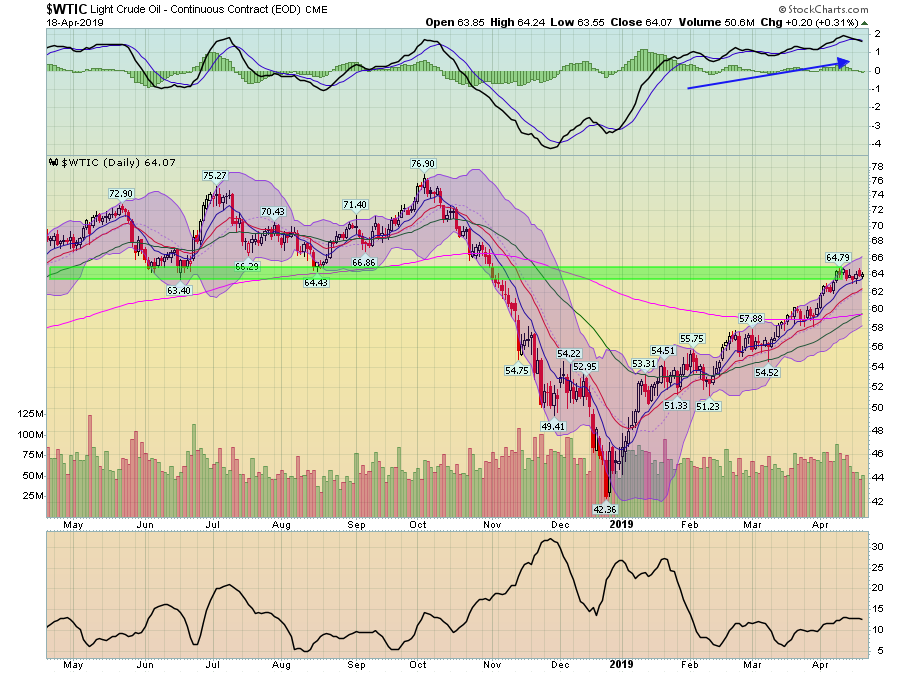
After re-imposing sanctions on Iran, the U.S. granted oil export waivers to several large oil importers (including China, Japan, and South Korea), allowing these countries to continue to purchase Iranian oil. That is no longer the case. Before these sanctions, the IEA was projecting a 500,000 bbl/day supply deficit for 2019. This news should have a bullish effect on oil prices, which are already in the middle of a strong rally:
Today was very much a "nothing" day in the market. So, I wanted to revisit my basic market thesis to determine if it still held. To review:
The markets are "toppy"; the rally in the Treasury market and large-cap equity indexes and underperformance of the smaller-caps indicates traders are projecting weaker growth. For my thesis to change, I need a Treasury market selloff and/or a stronger small-cap performance.
To a certain extent, we've had a modest Treasury market selloff:
The IEF (top row, far left) is down 1 1/2 points while the TLT (bottom) is off 6 points. This is - at least partially - a simple function of basic economics: with inflation running at about 2%, the real yield on the 7-10 year was about 40 basis points. While it is of course theoretically possible for the 10-year to keep rallying, from a practical perspective its ascent was constrained by inflation, as was the 30-year. However, the selloff is modest and could also be seen as a simple measure of profit-taking rather than a meaningful change in sentiment.
Let's turn to the equity indexes:
There's good and bad news above. On the plus side, the QQQ and SPY (bottom two charts) along with the OEF (top row, far right), are all rallying. As these are comprised of large-caps, we still have the same problem as before. Mid-caps (top row, far left) have rallied a bit and is now off 6-month highs. But micro and small-caps (top row, middle two) are still moving sideways.
The Treasury selloff and rally in the mid-caps are positive developments which push the argument towards the bullish camp. But without the smaller companies rallying, it's still hard to see a meaningful advance.
Disclosure: I/we have no positions in any stocks mentioned, and no plans to initiate any positions within the next 72 hours. I wrote this article myself, and it expresses my own opinions. I am not receiving compensation for it (other than from Seeking Alpha). I have no business relationship with any company whose stock is mentioned in this article.

