Over the last week, I was on vacation with my family taking a much-needed respite from the weekly workload.
The good news is that usually when I go out of town, the market crashes. Such was not the case, and in fact, the Dow Industrials hit all-time highs. I pay little attention to the Dow due to the limited number of holdings in the index, so, despite headlines of the Dow’s achievement, the S&P 500, a better representation of the economic backdrop of the country, made little progress. As I noted in the last weekly newsletter:
“Our existing client portfolios are fully allocated to the market in accordance with their model allocations. New client portfolios are being slowly allocated into their models as the market breaks out of consolidation levels to new highs.
All accounts have had stop limits raised to current running support trend lines.
The current advance continues to remain intact despite a lack of legislative action, weaker economic and inflationary data and less than inspiring forward guidance on the earnings front.”
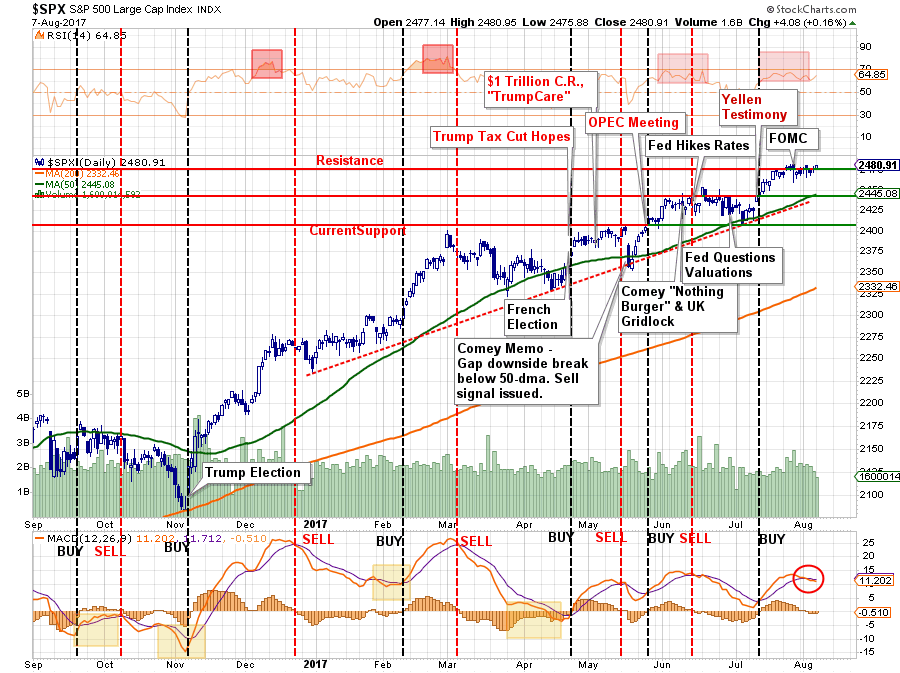
“As shown in the bottom part of the chart above, on a very short-term basis the market currently remains on a ‘buy signal,’ however, the weakness of the market over the last couple of days has led to some deterioration. Furthermore, the market is struggling with recent resistance levels as the overbought condition continues to limit the advance.
If the market can pull back to support, and work off some of the overbought condition without triggering a broader ‘sell signal,’ we will add exposure to client portfolios.
We remain cautious, however, on the type of ‘risks’ we take on in portfolios. Capital preservation always remains our priority over chasing returns.”
So, in effect, nothing much has changed in the past week. However, while the market remains bullishly biased there are numerous “bearish signals” that should be paid attention to. While these signals do not necessarily suggest a bear market is imminent, these signals have all been present when previous bear markets have begun.
Bull Hopes, Bear Signals
Importantly, the “buy” signal that was registered following the November election, has now flipped back to a “sell” signal. These signals have usually been indicative of short-term corrective actions which can provide for better entry points for trading positions and rebalancing.
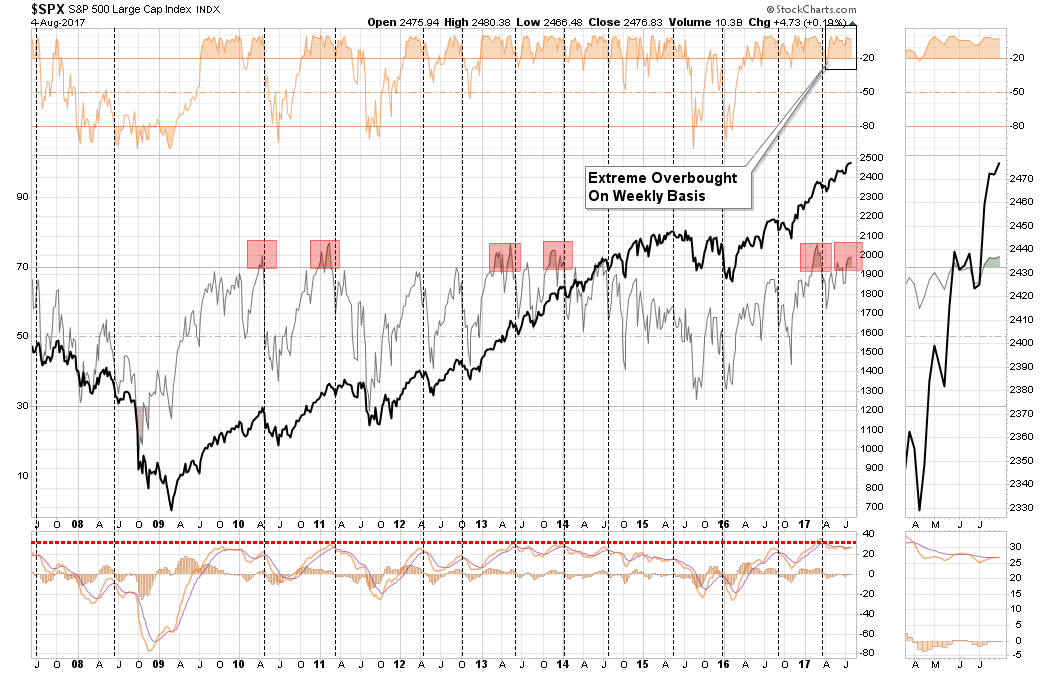
As shown below, on a longer-term basis the backdrop is more indicative of a potential correction rather than a further advance. With an intermediate-term (weekly) ‘sell’ signal triggered at historically high levels, the downside risk currently outweighs the potential for reward.
Internal measures of the market have also weakened substantially in recent months. The problem is while the stock market has pushed higher, both the ratio and number of stocks trading above their respective 50 and 200-day moving averages have continued to weaken.
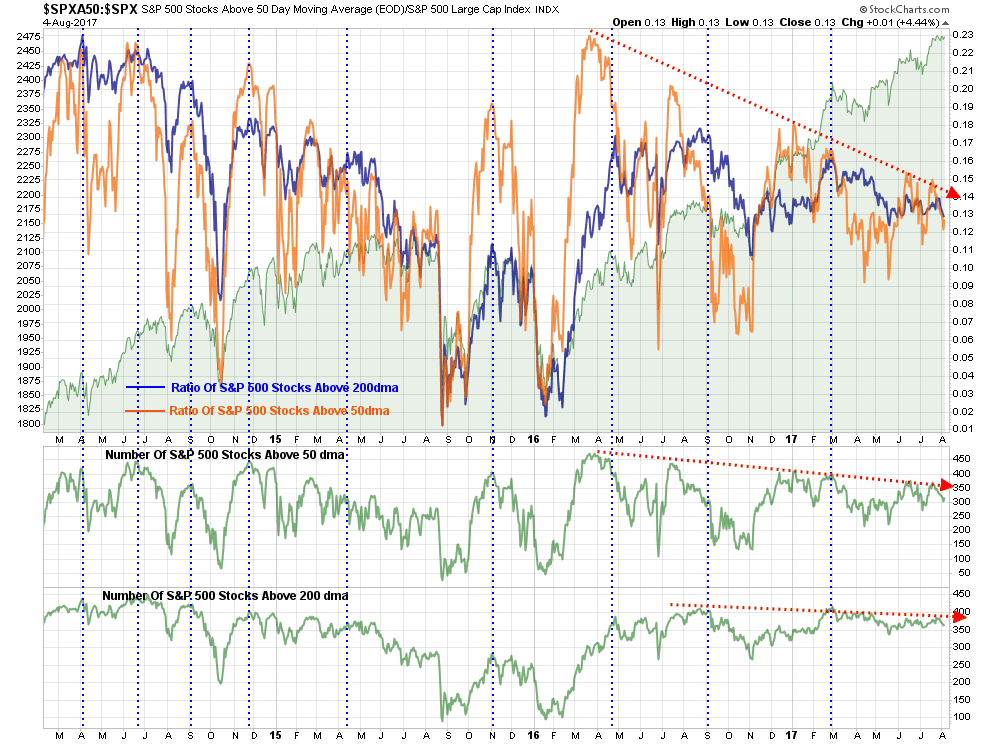
This divergence will likely not last much longer, the only question is whether the internals will “catch up,” as the “bulls” currently hope?
Deviations from both intermediate and long-term moving averages have also reached levels that become problematic for further advances without a correction first. The first chart is the percentage deviation from the 200-day moving average. At almost 7%, it is one of the larger deviations over the last 3-years and, as shown, has always resulted in at least a short-term correction.
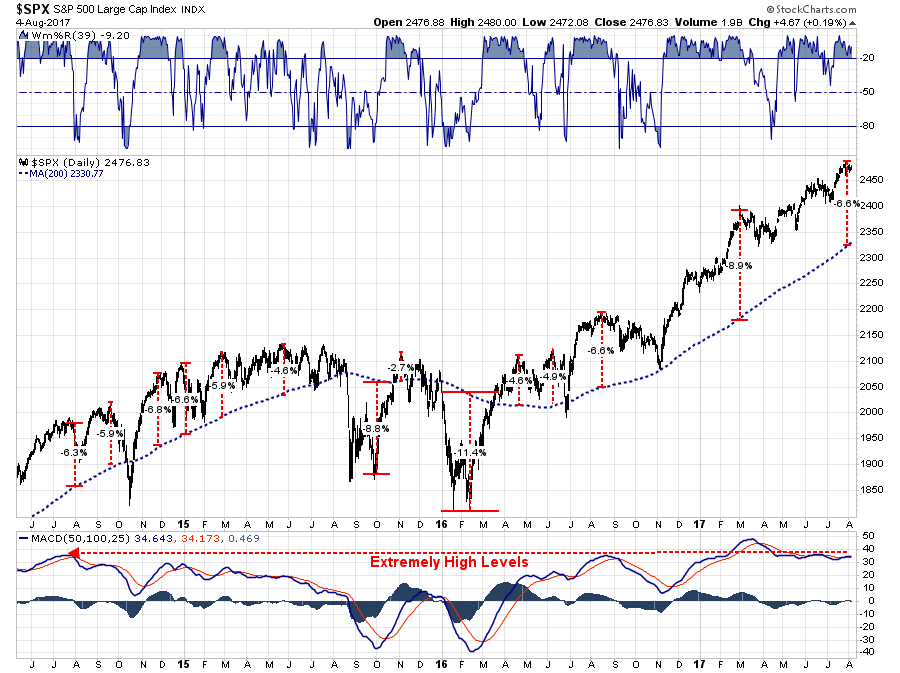
However, while the short-term corrections have been mild, and “buy the dip” opportunities which are always the case in a strongly trending market, the bigger concern comes from the deviation from the 3-year moving average as shown below. At 3-standard deviations, and 17% above the long-term moving average, the risk of a “mean reverting event” has risen markedly.
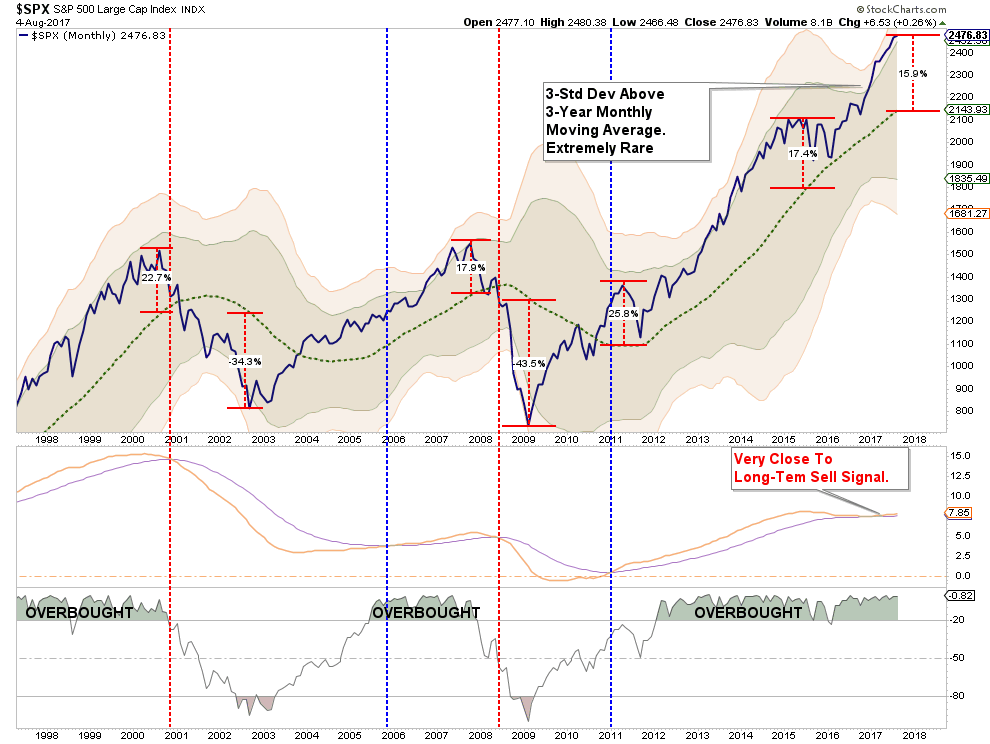
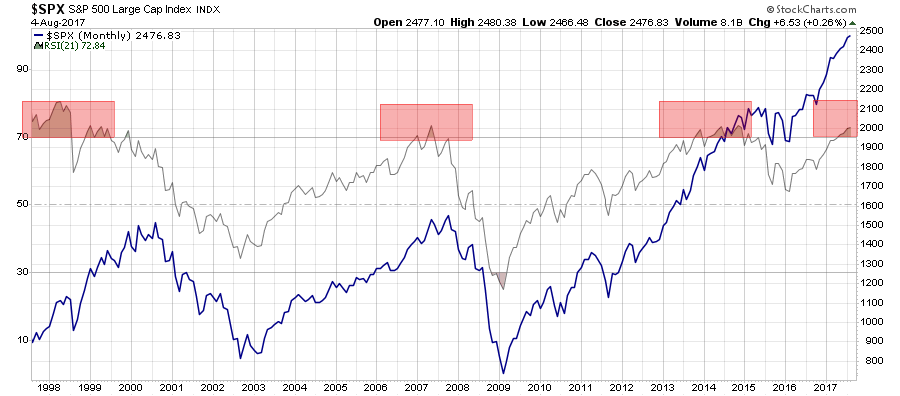
With the long-term “sell signal” very close to triggering, investors would be well-advised to administer some risk controls within their portfolio allocation models. The same can be seen below where the 21-month RSI has pushed into extremely overbought territory which has previously preceded more significant corrections and bear markets previously.
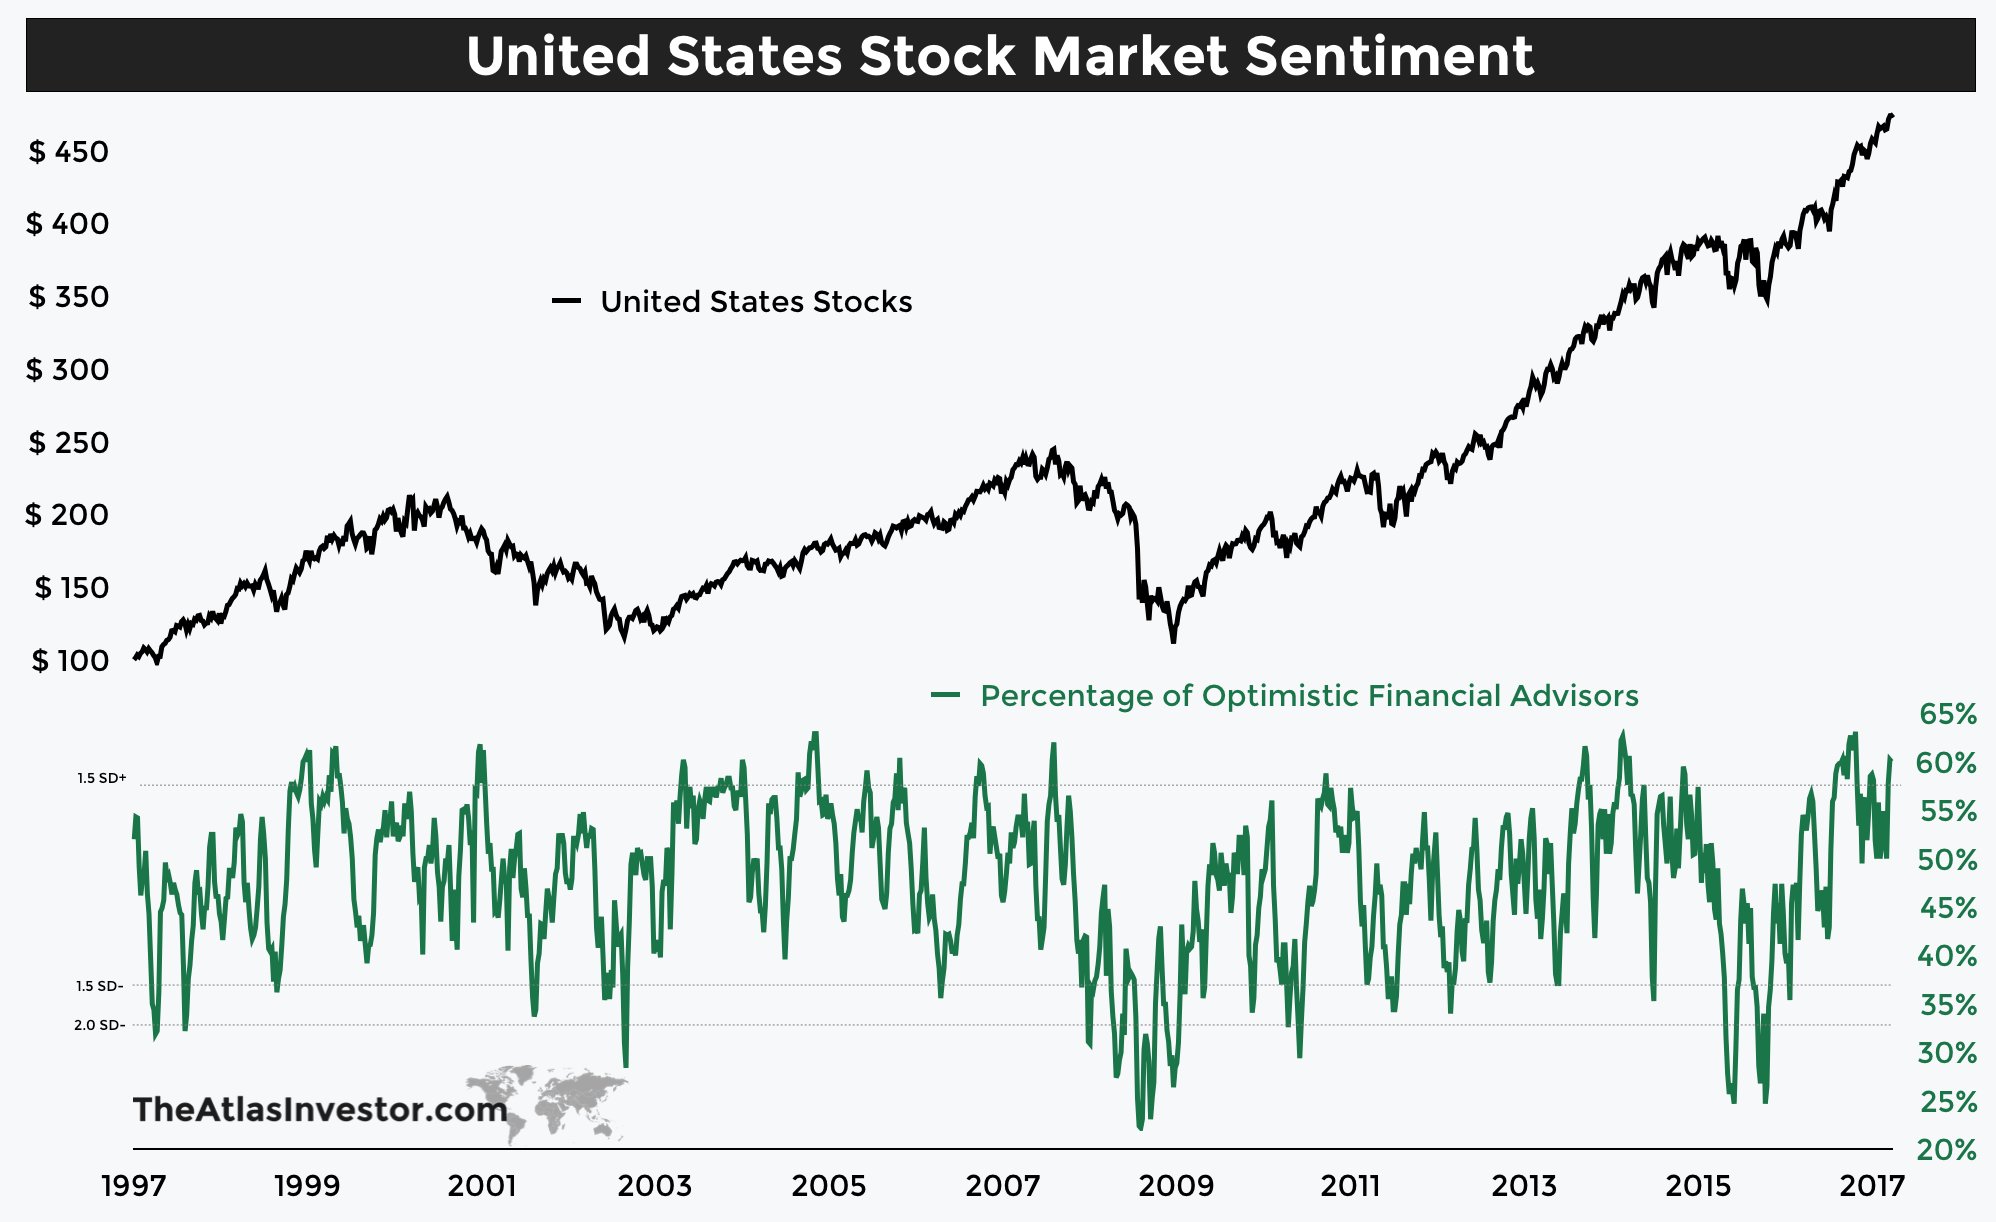
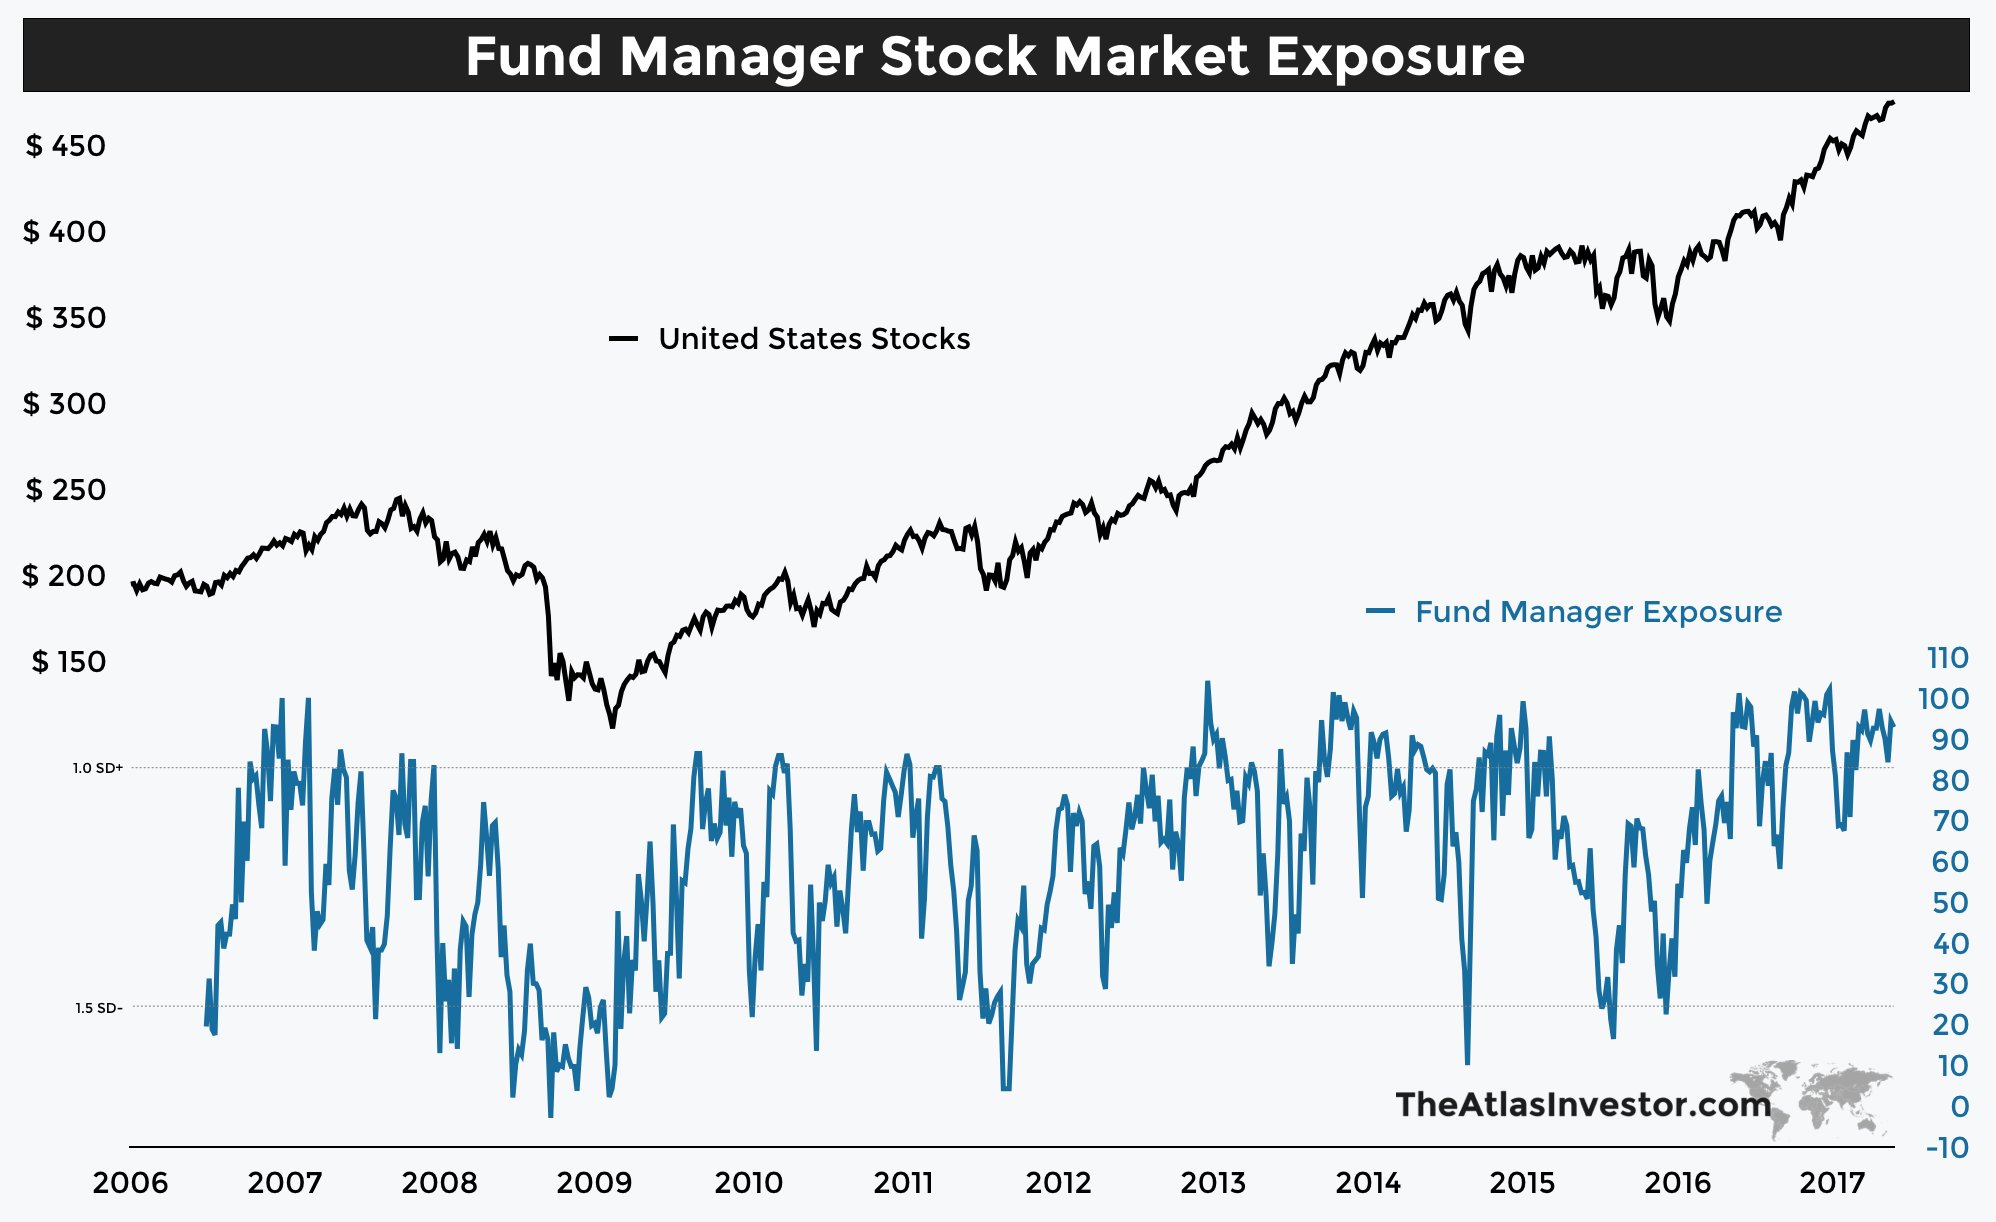
Of course, the run up in the markets which has created these more extreme deviations have come from the “bullish exuberance” of investors jumping into the markets at this rather late stage of the bull market advance. As shown below, courtesy of TheAtlasInvestor.com, both the bullish sentiment of professional advisors and fund managers has reached more exuberant levels.
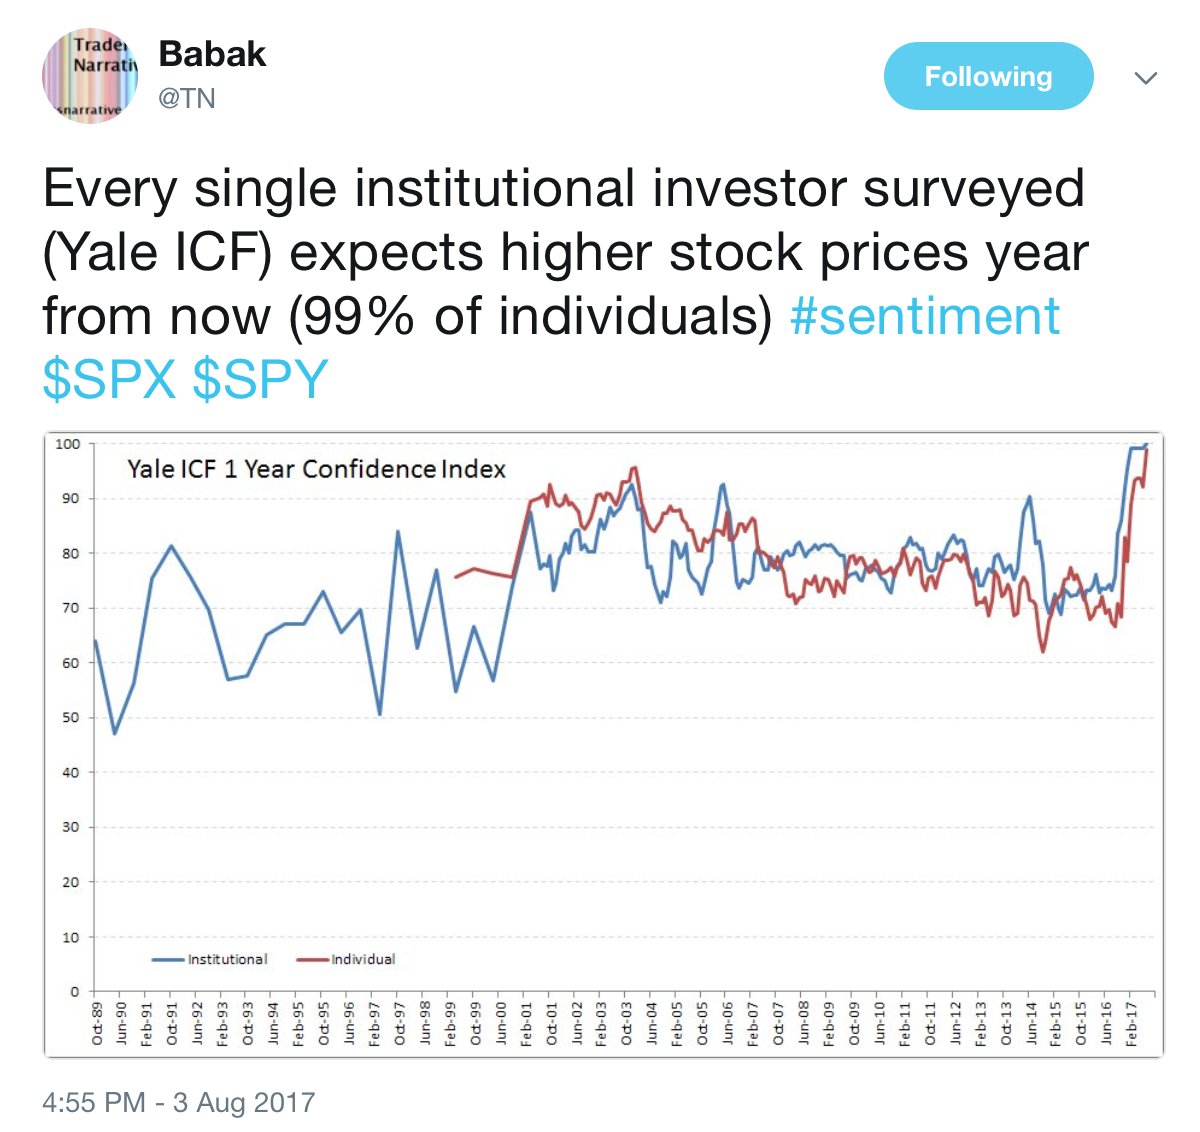
And as noted by Tiho Babak just recently, even the Yale survey has exploded with bullish exuberance.
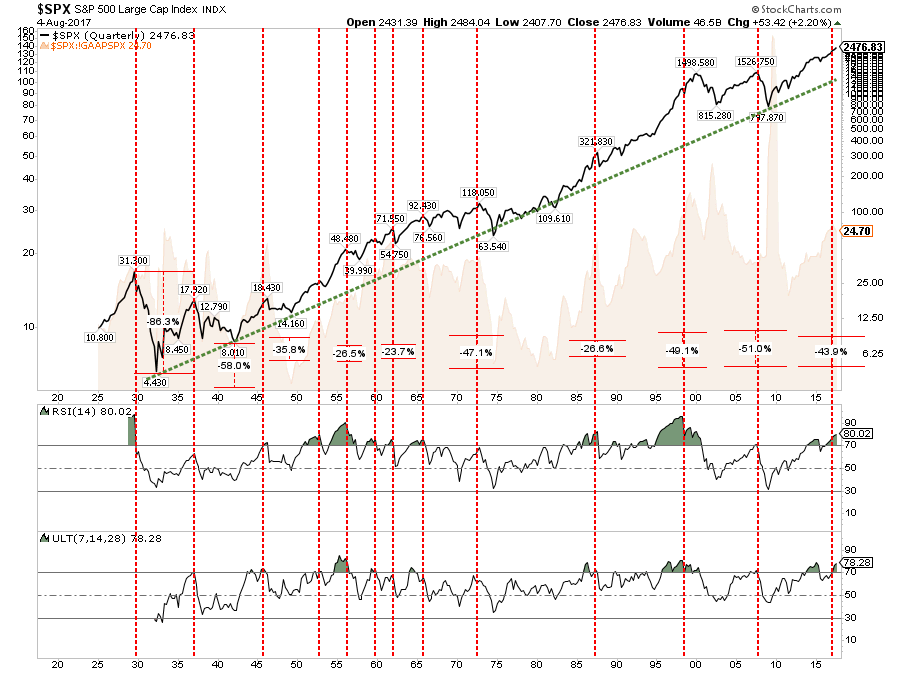
Of course, as the final chart shows below, while the bulls are clearly in charge of the market currently, and could be for quite a while longer, such deviations from the long-term growth trend do not last indefinitely.
Again, let me restate for those who insist I am bearish, the market is in a bullish trend currently and as such equity exposure should remain tilted to the “long” side. However, being allocated to the financial markets without an understanding and appreciation of the mounting risks is simply foolish.
With the markets extended, and moving into the two months of the year that have seen more than their fair share of historical corrections, it is a good opportunity to clean up and reduce excess risk in portfolios.
- Tighten up stop-loss levels to current support levels for each position.
- Hedge portfolios against major market declines.
- Take profits in positions that have been big winners
- Sell laggards and losers
- Raise cash and rebalance portfolios to target weightings.
An important point to remember is that STOCKS DO NOT preserve capital, but BONDS do. Even if interest rates do reverse for some reason, while bond prices may fall the corpus is still returned to the investor at maturity along with all interest payments along the way. Such is not the case for equities.
Eventually, even the best house in a bad neighborhood is devalued. Globally low interest rates and falling inflationary pressures are not a function of financial market strength, but rather global economic weakness. There is only one way such a backdrop will end.
For now, the party rages on with little regard for the consequences of partying too long or too loudly. There are always a few who leave the party too early, but the consequences are substantially worse for those who stay too long.
“There is nothing riskier than the widespread perception that there is no risk.” – Howard Marks
