On Monday, the market opened the 2nd half of the year with a fumble as Wall Street continues to wrestle with the uncertainty stemming from the White House with regards to tariffs, geopolitical risks, and economic growth. After a sloppy open with the S&P 500 down 14 points, investors managed to grab the ball and run it back for an 8-point gain. However, the participation and volume left much to be desired.
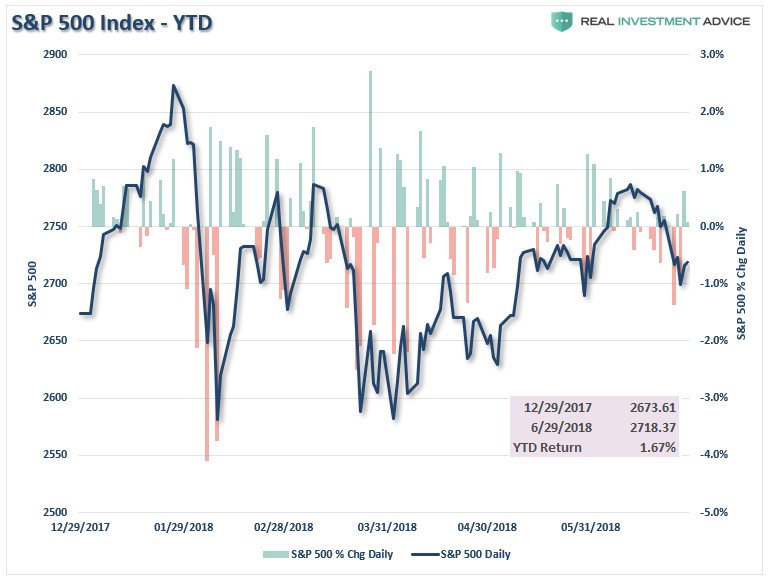
Stepping back to the beginning of the year, Barron’s penned an outlook for 2018 suggesting the markets would climb 7% in 2018 fueled by strong earnings growth. While it certainly seemed that way coming out of the gate in January, the markets have since struggled to maintain breakeven with the market only rising 1.67% for the 6-month period ending in June.
Bonds have had a rough go of it this year as well. While bonds have lost roughly 3% in price so far this year, bonds have continued to be the “go to” asset class during market sell-offs. Despite predictions of surging interest rates this year, which has been the case for the last several years, rates have remained mired below 3% as economic growth struggles to gain traction.
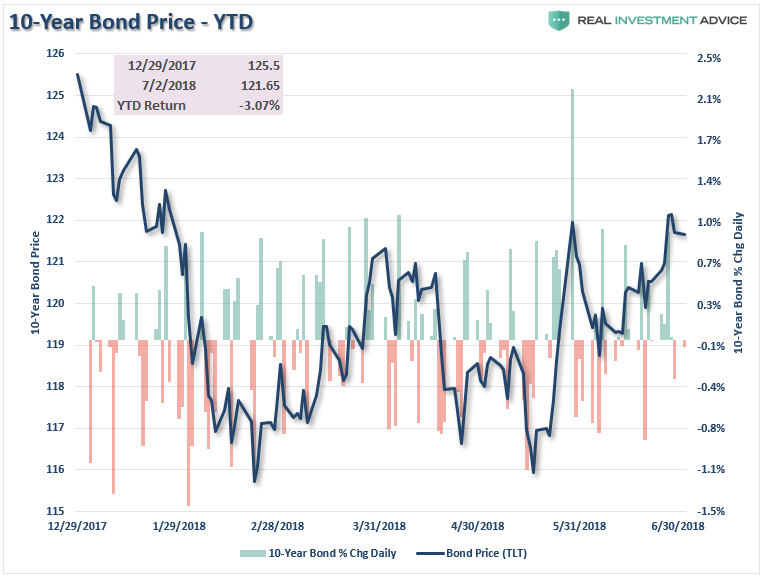
For investors, performance so far this year has fallen well short of expectations. Year-to-date, a typical 60/40 stock bond portfolio, on a capital appreciation basis only, has returned:
(1.67% * .60) + (-3.07% * .40) = 1% – 1.2% = -0.2% YTD.
Throw in dividends and interest income and basically, you only performed slightly better than a money market account with a whole lot more price volatility and implied risks.
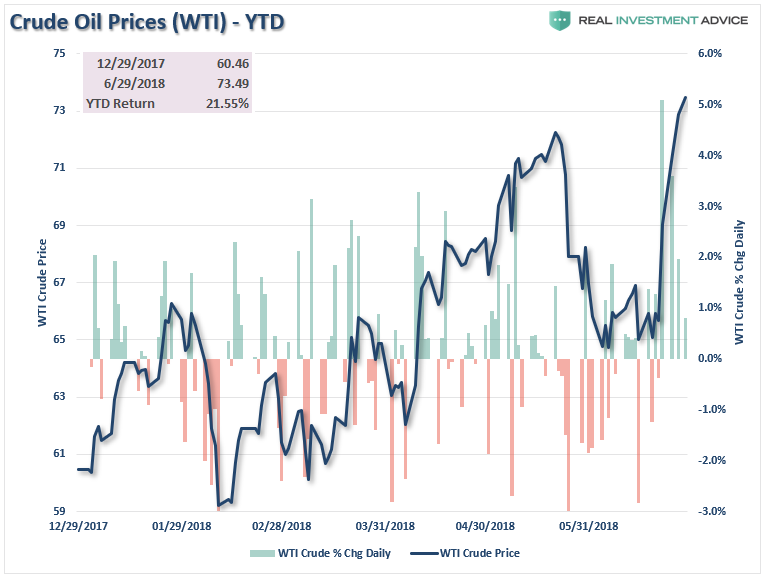
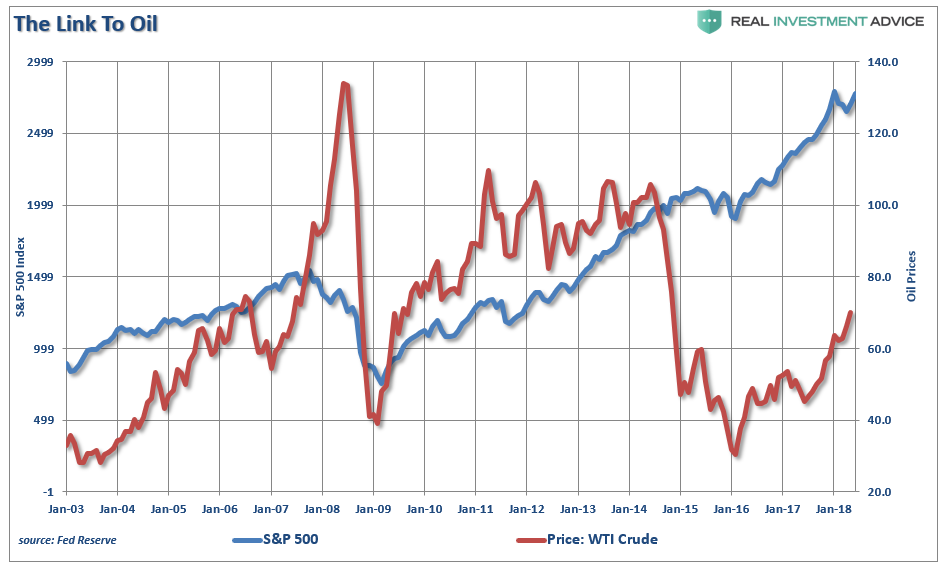
The big winner so far this year has been oil prices. Oil prices are up more than 20% since the beginning of the year due to concerns over supply disruption, Iran, and OPEC. Optimism has led commodity traders to run up net long positioning on oil to some of the highest levels ever on record.
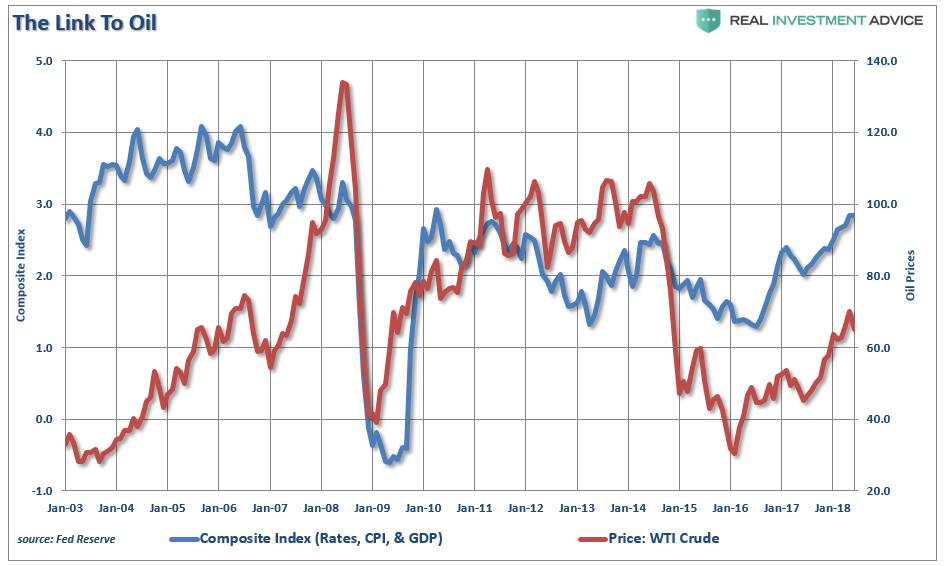
Importantly, as I recently discussed in “Bulls Keep It Together,”
“The chart below shows oil prices as compared to a composite index of real GDP, interest rates and the consumer price index (CPI). As shown, the recent uptick in economic growth, inflation, etc. coincides with the recent surge in energy prices.”
“There is also a very high correlation between the direction of oil prices and the S&P 500 index. This is particularly the case since the 2016 lows as oil prices have made up a bulk of the surge in corporate earnings during that time.”
“There are four threats to oil prices in the near term:
- A surge in the U.S. Dollar which would likely coincide with a “trade war.”
- A reversal by OPEC countries to start sharply increasing production.
- A continued surge in supply (shale) in the midst of global economic weakness.
- More rhetoric from the current Administration that “oil prices are too damn high.”
With commodities traders, all crowded on the ‘same side of the boat’ a reversal could be sharp. All that is really needed is a technical breakdown that spooks oil traders to flee for the exits. The last few times ‘sell signals’ have been registered in combination with extreme overbought and overly exuberant positioning, the outcomes have not been good.”
While there is a decent correlation between the direction of energy prices and the markets, it is something to follow as we move into the last half of the year. Higher energy prices, in the short-term, push inflation, retail sales, and other economic data higher. However, in the longer-term, higher energy prices are a tax on the consumer and contributes to a drag on corporate earnings, economic growth and ultimately the market.
Earnings
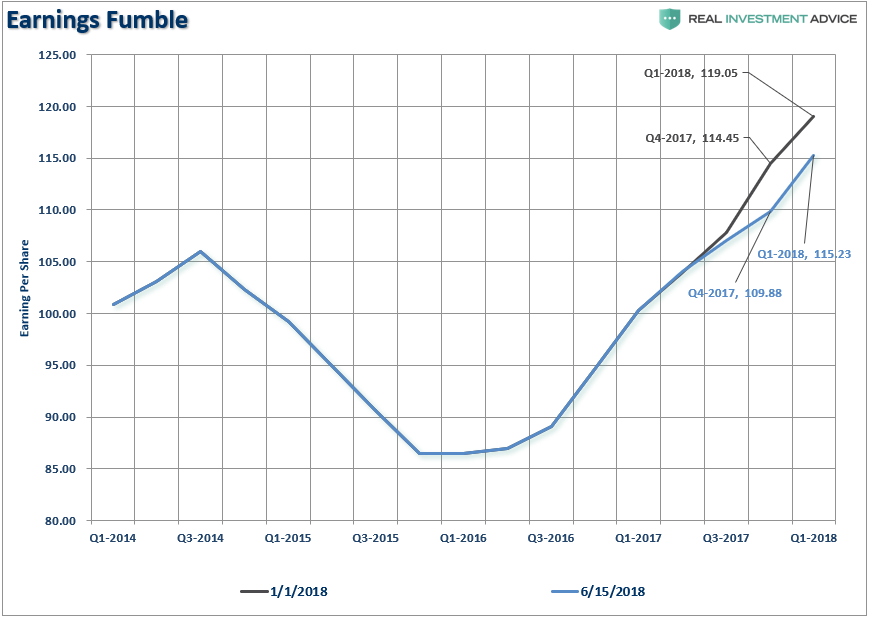
Speaking of earnings, earnings have come in short of expectations as well. In January, analysts expected the S&P 500 to show reported earnings of $114.45 for Q4 of 2017 and $119.05 for Q1 of 2018. Reality proved a bit disappointing as results came in at $109.88 and $115.23 respectively. You should expect these numbers to revised substantially lower as we progress into the back half of the year.
As I discussed in “The Risk To Estimates:”
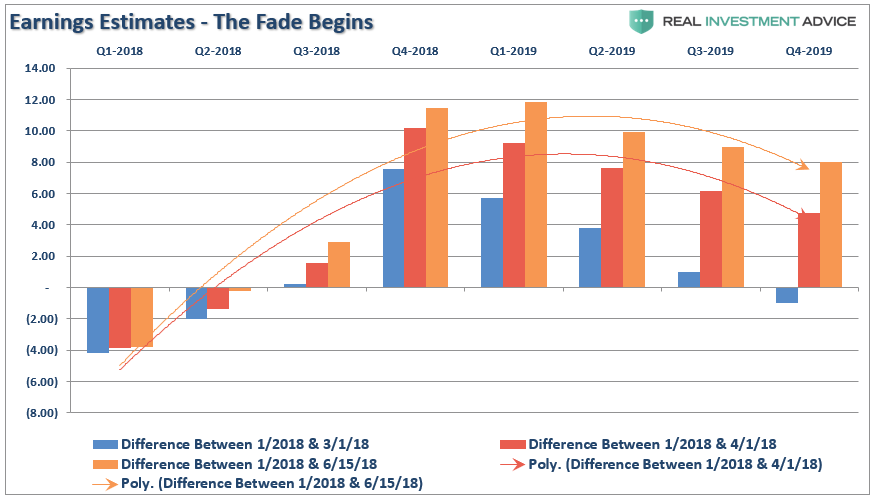
“Since then, analysts have gotten a bit of religion about the impact of higher rates, tighter monetary accommodation, and trade wars. As I wrote yesterday, the estimated reported earnings for the S&P 500 have already started to be revised lower (so we can play the ‘beat the estimate game’). For the end of 2019, forward reported estimates have declined by roughly $6.00 per share.”
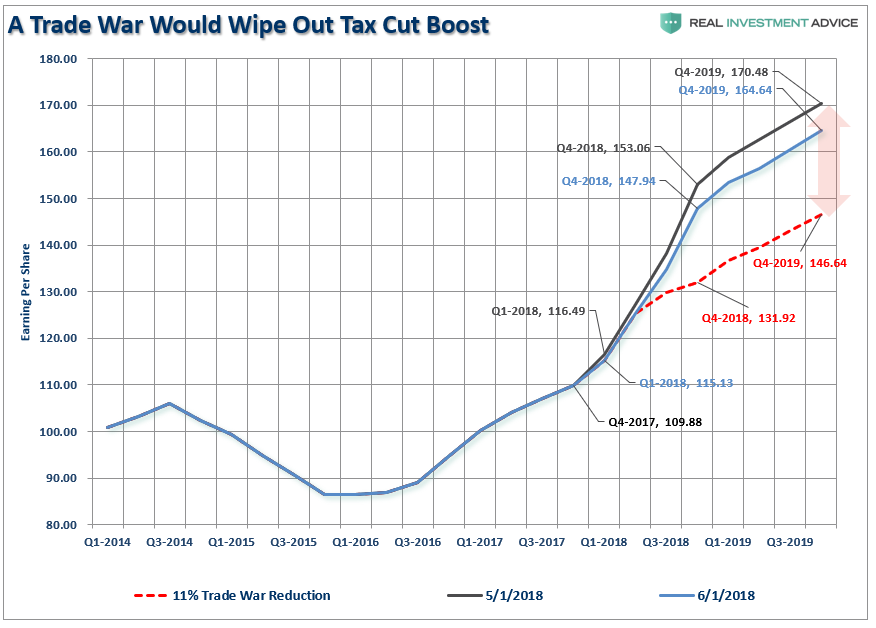
“However, the onset of a ‘trade war’ could reduce earnings growth by 11% which would effectively wipe out all of the benefits from the recent tax reform legislation.
As you can see, the erosion of forward estimates is quite clear and has gained momentum in the last month.”
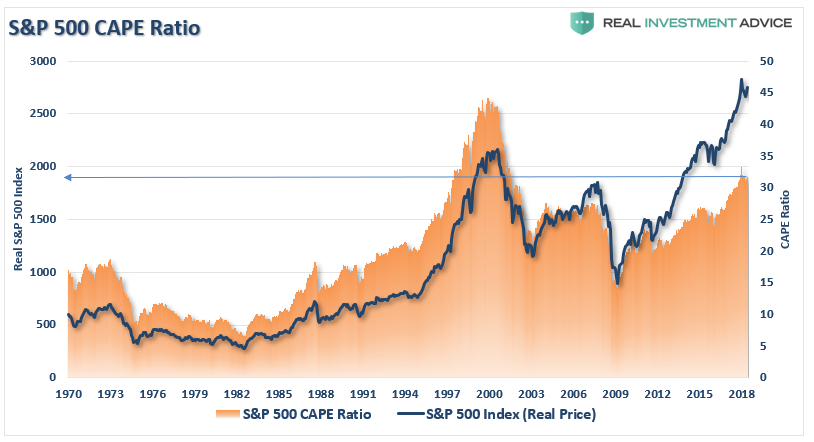
While analysts continually push estimates lower, so companies can beat them, valuations remain extremely elevated. As of the end of June, the S&P 500, based on Shiller’s CAPE ratio, was trading at 31.68 times. Despite sharply rising earnings, valuations remain extremely elevated relative to long-term historical norms.
Trend Review
As I have discussed many times in the past, we are long-term investors. However, we do manage the risk in the short-term to avoid more important market reversions that could negatively impact long-term capital appreciation. “Getting back to even” is not an investment strategy we wish to employ – neither should you.
Daily
As I noted in this past weekend’s missive:
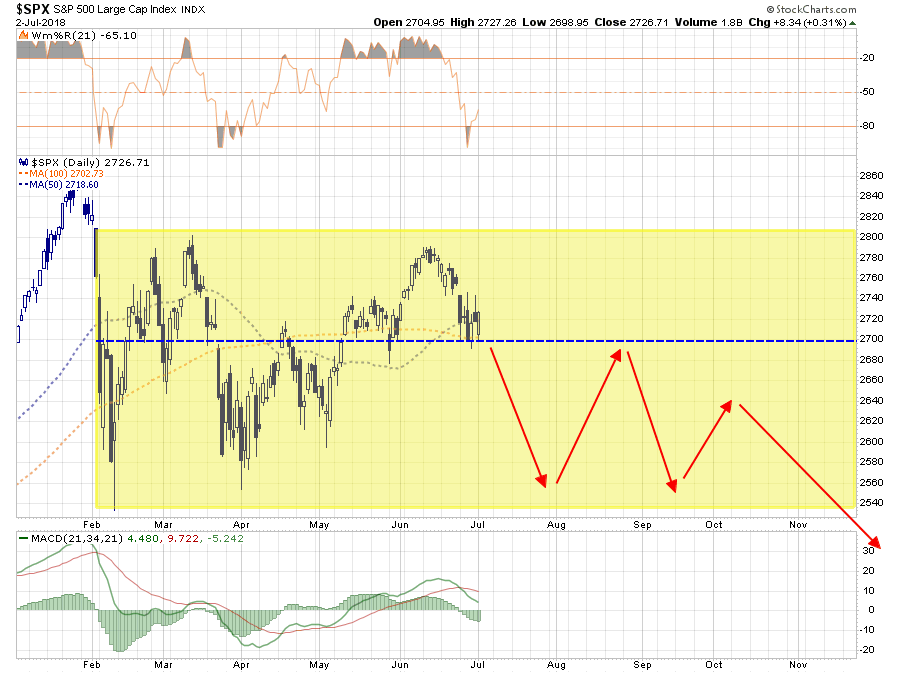
“The market failed twice in trying to climb back above the 61.8% Fibonacci retracement level which kept the market confined to the same tight trading range we saw in May. Because of the breakdown on Monday, we DID NOT increase equity exposure in portfolios as of yet. With 50% of portfolios currently in cash and fixed income, the damage from last week’s sell-off was mostly mitigated. (This is the advantage of cash and fixed income in a volatile market.)”
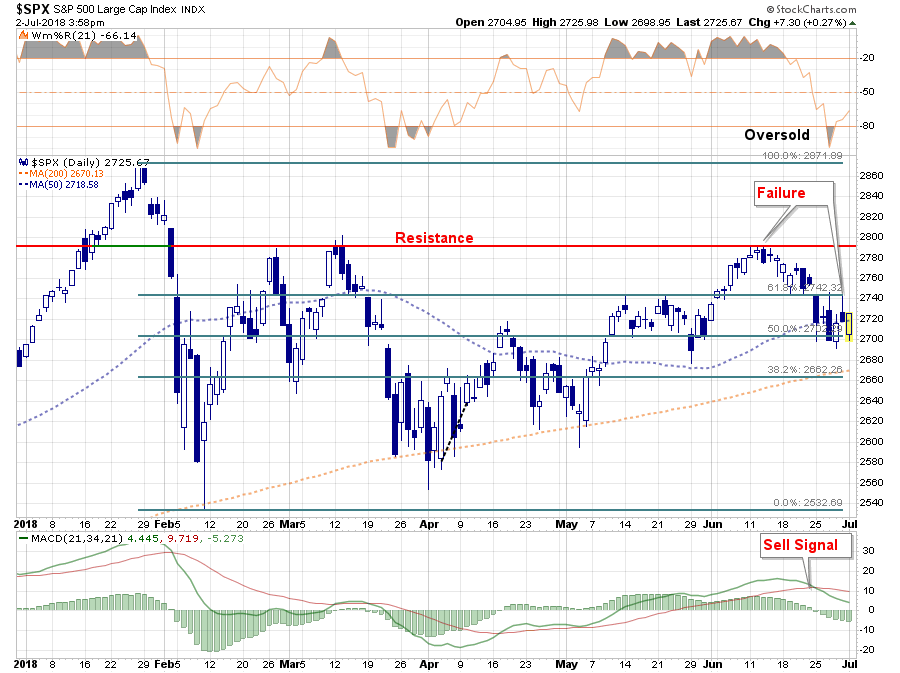
On Monday, the market maintained support at the 50% retracement level and was also able to climb back above the 50-dma. With a “sell signal” currently firmly in place, the pressure on asset prices in the short-term is negative. Going into the last half of the year, I have laid out the potential trading range of the market based on current levels.
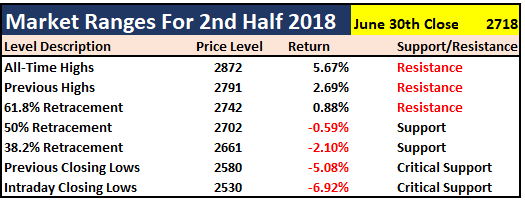
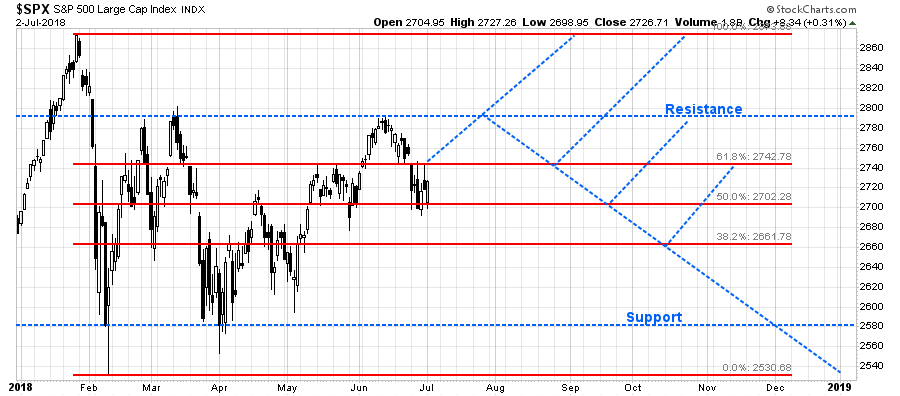
Improving earnings, a resolution to the current “trade war,” and some relaxation of geopolitical risks could certainly give the bulls what they need in the short-term to rally the markets higher. Currently, despite the volatility of the first half of the year, “bullish optimism” remains well intact. However, a confirmed break of major support will reflect a “changing of attitudes” which will likely coincide with some unexpected exogenous event.
My partner, Michael Lebowitz has a slightly more bearish short-term opinion but in the longer run, which I will discuss, we are on the same page. He believes direction will be determined when the market breaks out of the yellow shaded area below. A break above the box accompanied by new record highs would likely signal a resumption of the bull market. Unfortunately, Michael fears the market will break out to the downside over the course of the next six months and provide confirmation that a topping process for the ten-year bull market is in place. In the meantime, the market will likely use 2700 as a line of support and then resistance.
Weekly
For portfolio management purposes, we prefer weekly data as it smooths out the daily volatility of the markets. Subsequently, the reduced volatility removes some of the “head fakes” and “whipsaws” which can occur during mid-week due to the increased speed at which information, and trading activity, flows through the market.
More importantly, weekly data tends to reveal the trend of the market. As portfolio managers, our job is to participate with the trend as long as that trend is moving in a positive direction. Breaks of the trend, and changes in the trend, are the drivers which lead to more significant changes in overall portfolio allocation models.
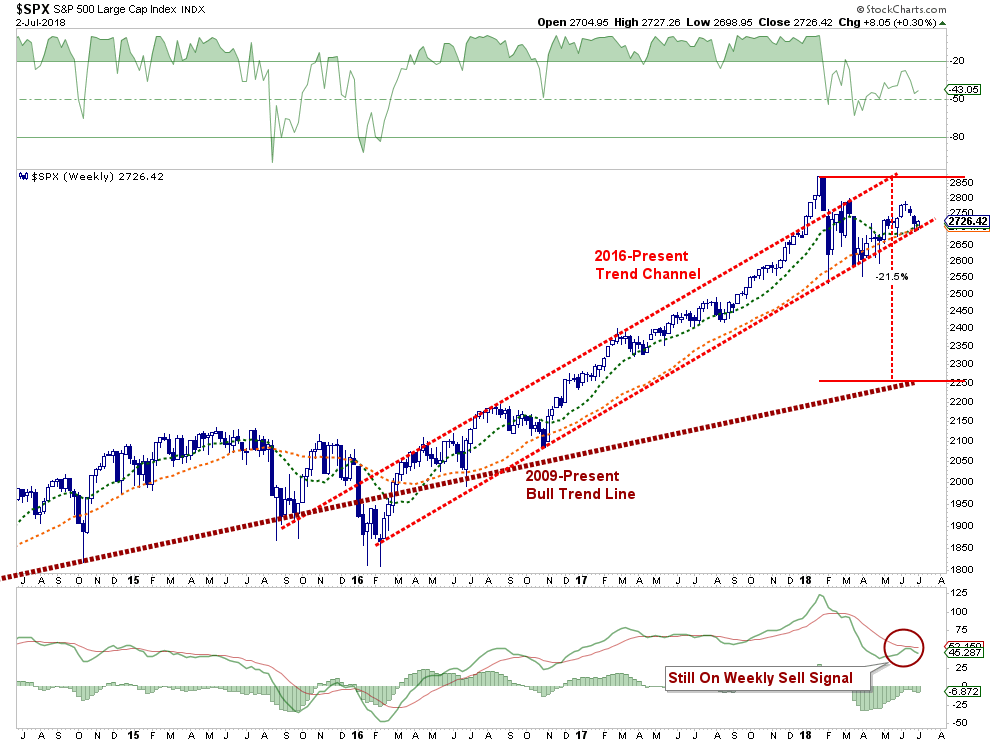
As we have repeatedly addressed in our reports, we remain weighted towards equity risk in portfolios currently as the overall trend remains positive. However, the markets are currently testing the accelerated bullish trend from the 2016 lows. A confirmed break will likely lead to roughly a 21.5% correction from this year’s highs to the bullish trend line from the 2009 lows. Such a break will trigger further reductions of equity risk in portfolios, an increase of cash and addition of portfolio hedges.
Monthly
Monthly data is good for understanding major turning points and overall market risk. However, in our opinion, monthly data moves too slowly to minimize portfolio risk properly. While we focus on the weekly data to manage portfolio and allocation risk, we certainly watch the monthly data to look for early warning signs of potential trend changes. The chart below shows the S&P 500 with a variety of indicators attached. When the majority of the indicators align, they have previously provided the “weight of evidence” needed to support more major changes to allocation models.
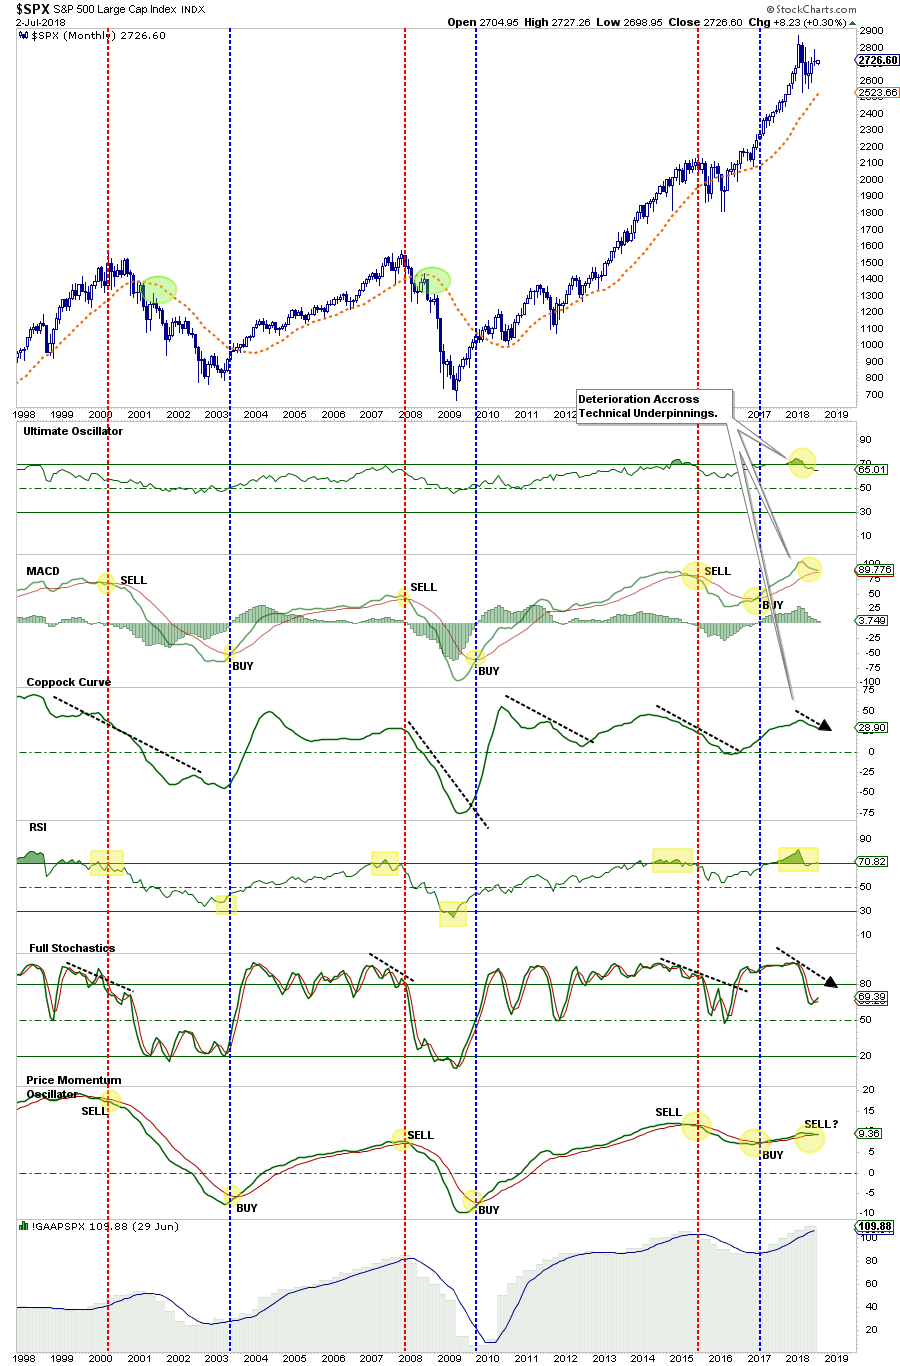
Currently, there are several indicators aligning to confirm more “risk” to the market over the next several months. However, since this is monthly data, we won’t know for sure until the data updates at the end of July.
Conclusion
With the first 6-months of the year behind us, performance has been markedly less than Wall Street was expecting. If the market is going to churn out 7-10% by the end of this year, the march higher needs to get underway soon.
I am reminded of a great quote by Axel Merk:
“Prepare yourself for volatility. It is the norm of the market. Focus on what you can control – margin of safety. By doing that you will be ready for most of the vicissitudes of the market, which stem from companies taking too much credit or operating risk.
Finally, don’t give up. Most people who give up do so at a time where stock investments are about to turn. It’s one of those informal indicators to me, when I hear people giving up on an asset class. It makes me want to look at the despised asset class, and see what bargains might be available.
Remember, valid strategies work on average, but they don’t work every month or year. Drawdowns shake out the weak-minded, and boost the performance of value investors willing to buy stocks when times are pessimistic.”
When it comes to investing it is important to remember that no investment strategy works all the time, but having some strategy to manage risk and minimize loss is better than no strategy at all.
