
European Session
EUR/USD
 EUR/USD Daily Chart" title="EUR/USD Daily Chart" width="474" height="242" />
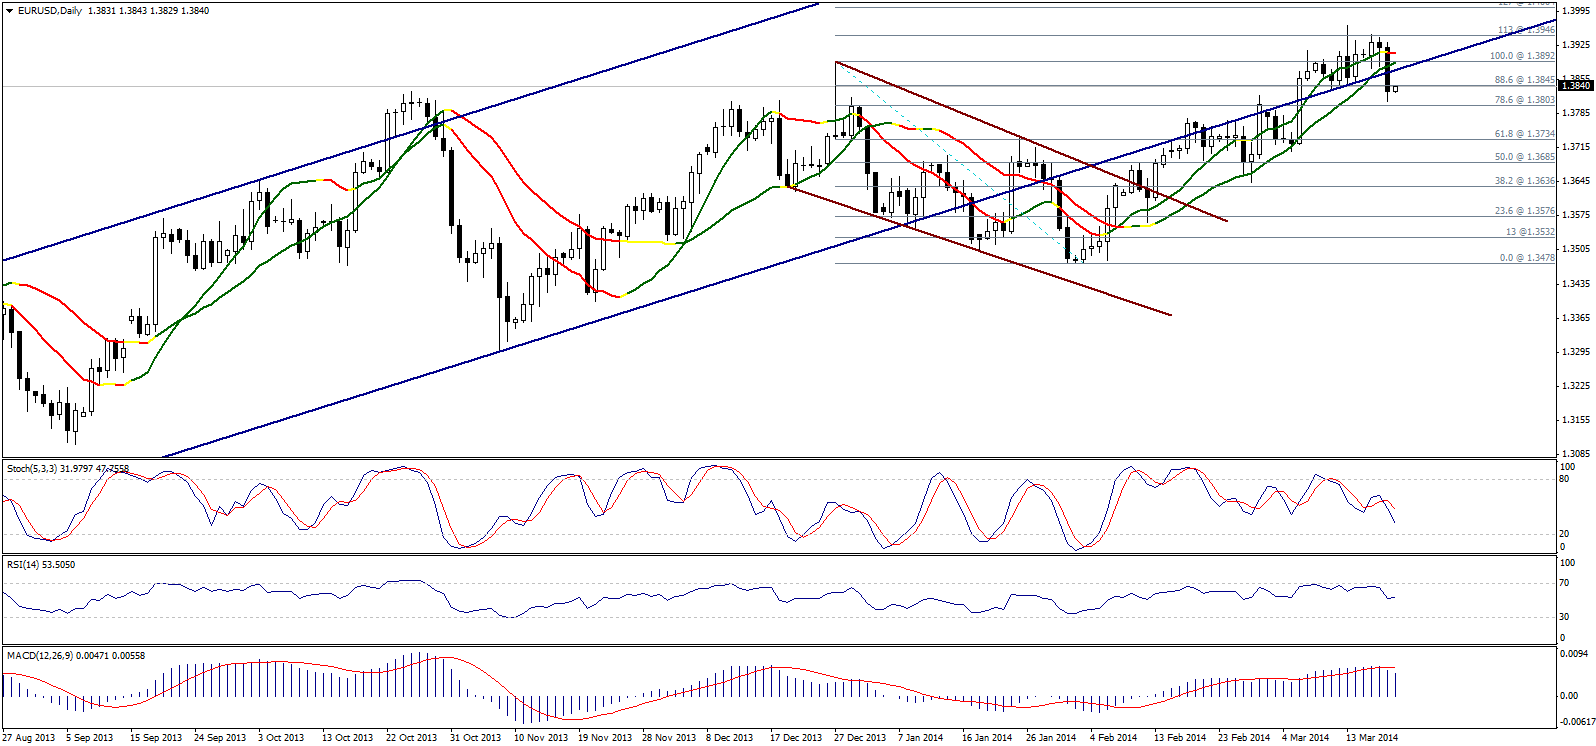
The pair dropped sharply yesterday achieving a daily closing below 1.3845 by forming a long bearish candle. The downside move showed the negativity of Linear Regression Indicator 34 for the first time since the fifth of last month, accompanied by the negativity of Stochastic.
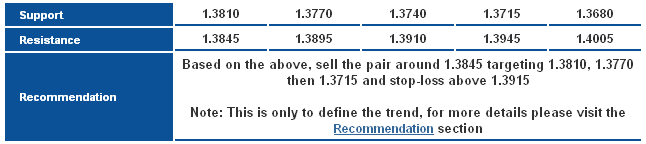
The bearish possibility is valid today but it requires breaking 1.3810 to confirm it. On the other hand, breaching 1.3895 weakens this possibility, while breaching 1.3945 fails any bearish possibility over intraday basis.
 EUR/USD S&R Chart" title="EUR/USD S&R Chart" width="474" height="242" />
GBP/USD
 GBP/USD Daily Chart" title="GBP/USD Daily Chart" width="474" height="242" />
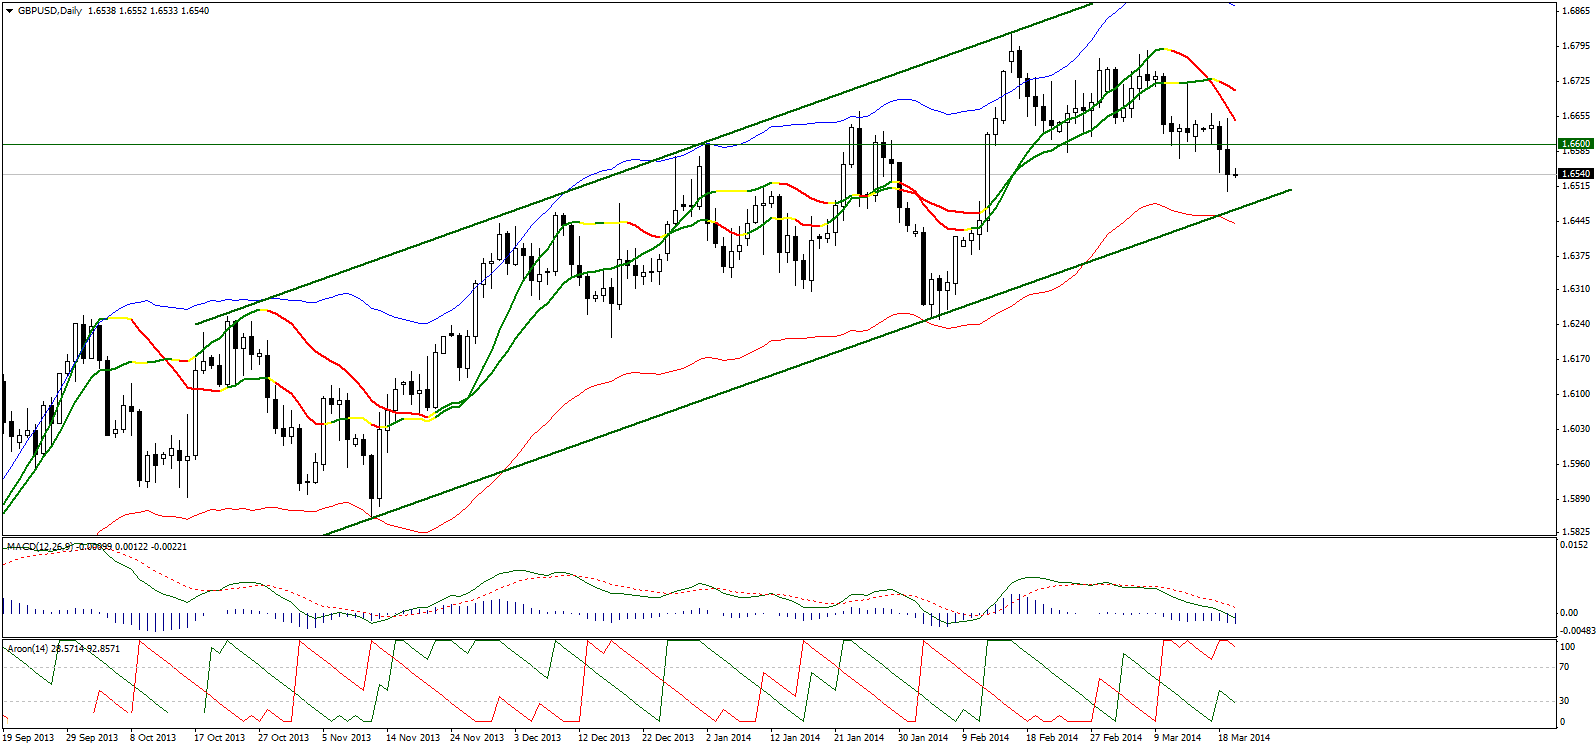
The pair declined yesterday and is trading stably below 1.6600 levels which is negative, while the upside move will return if the pair breached 1.6670.
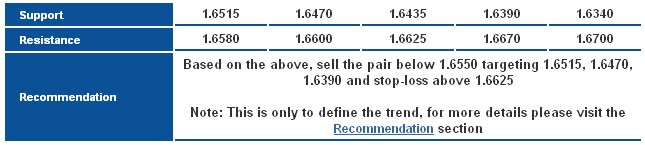
Linear Regression Indicators became more negative and MACD is moving further to the downside in addition to strengthening bearishness showing on AROON Indicator. Therefore, we expect today further bearishness. Of note, breaking 1.6470 is significant to push the pair further to the downside as will be explained in our next report.
 GBP/USD S&R Chart" title="GBP/USD S&R Chart" width="474" height="242" />
USD/JPY
 USD/JPY Daily Chart" title="USD/JPY Daily Chart" width="474" height="242" />
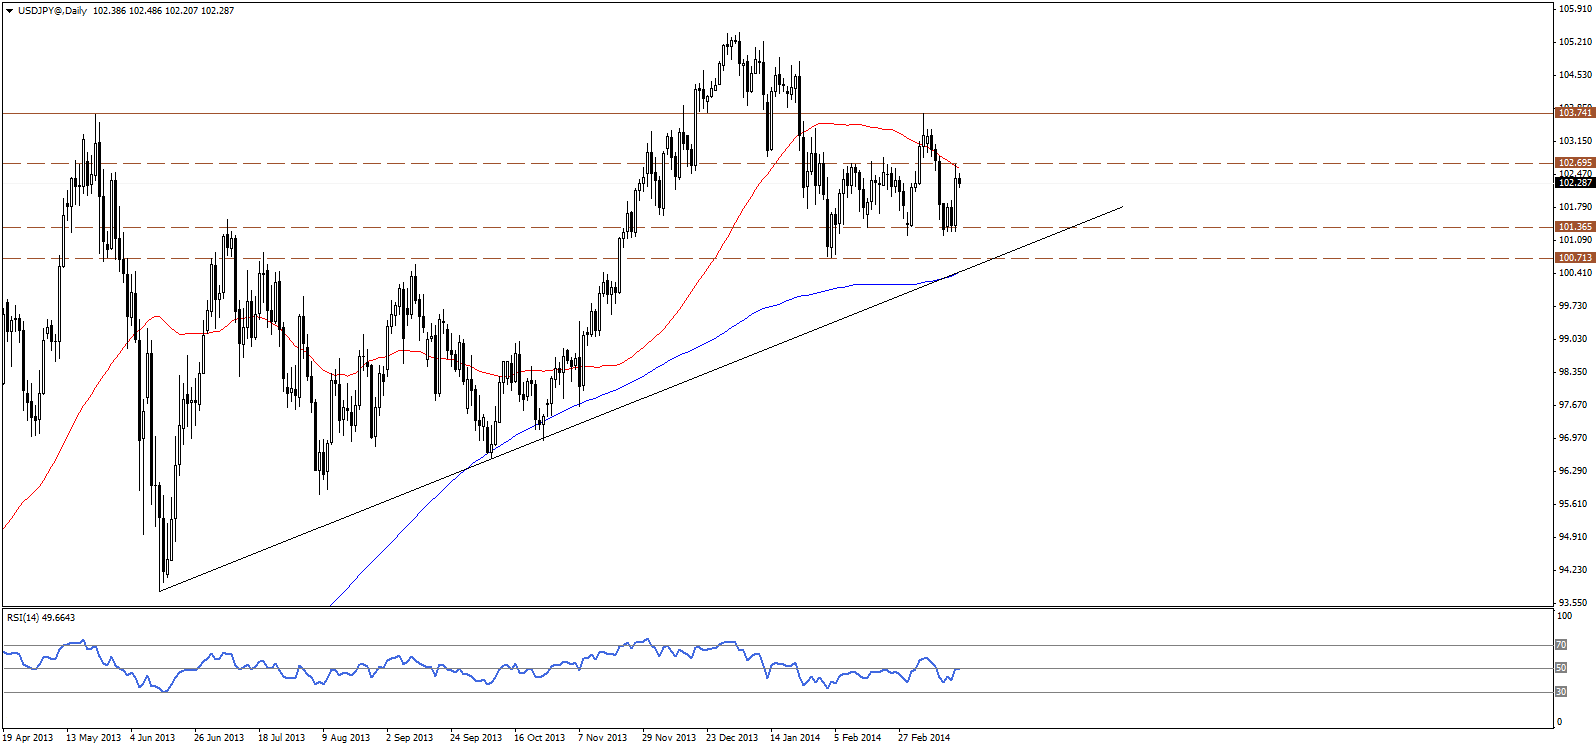
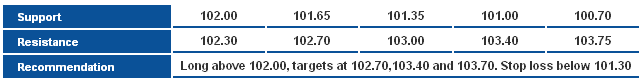
The USD/JPY rebounded strongly of 101.30 support area yesterday, hitting the 50-days SMA and 102.70 resistance level, before retreating slightly. A break above 102.70 is necessary now to confirm more upside over the short term, probably towards the next potential resistance at 103.75 level. The bullish bias is favored over intraday basis, and 101.90 should limit an extended downside correction.
 USD/JPY S&R Chart" title="USD/JPY S&R Chart" width="474" height="242" />
USD/CHF
 USD/CHF Daily Chart" title="USD/CHF Daily Chart" width="474" height="242" />
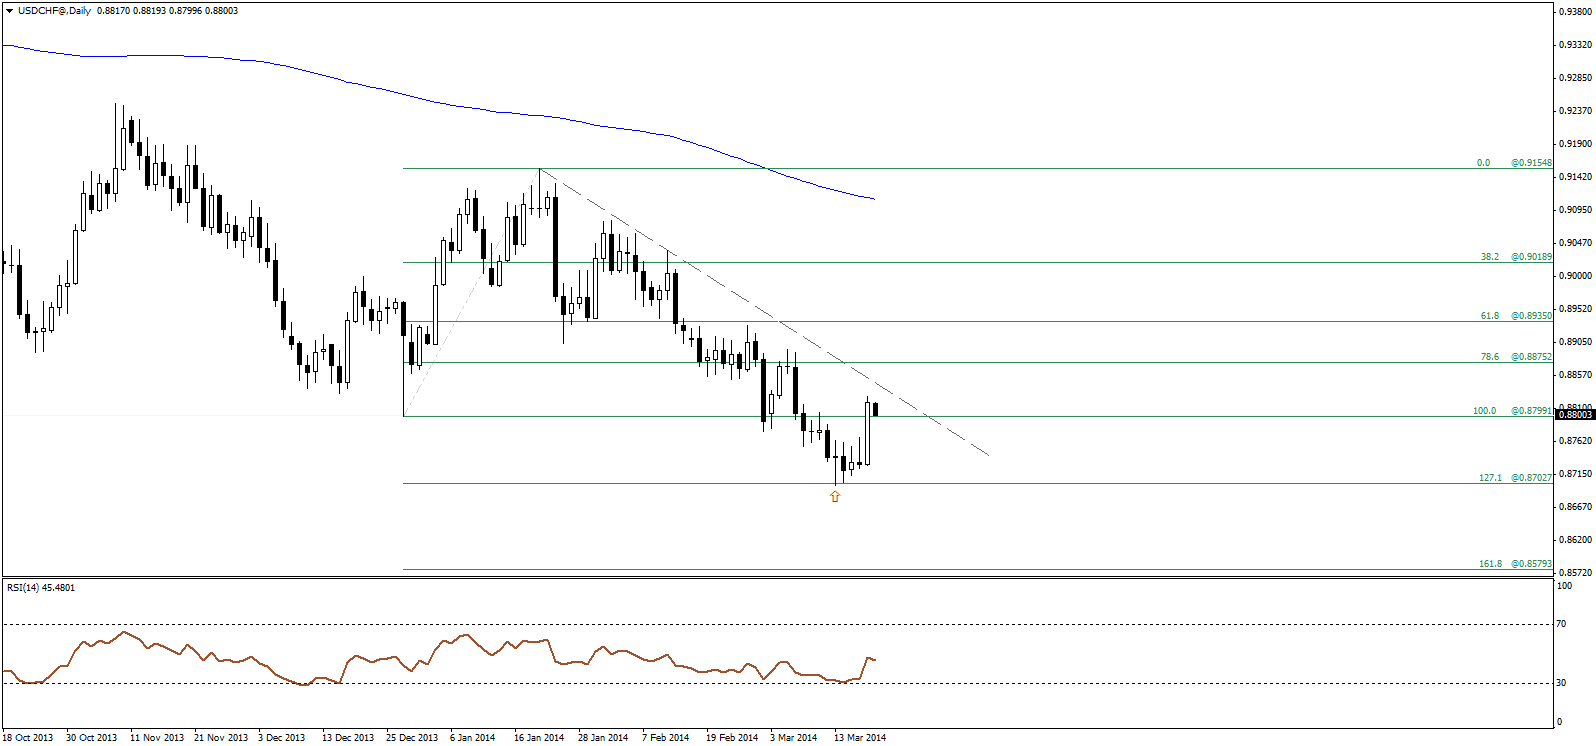
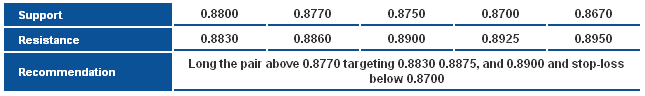
The USD/CHF rallied yesterday, breaking back above 0.8800 and approaching the main descending resistance for the bearish wave, after the 127.1 extension level managed to hold back further decline. The bullish engulfing candle yesterday hints we will probably see more upside over the short term, and a break above the aforementioned falling trend line should confirm this scenario, targeting 0.8875 and 0.8930 levels.
 USD/CHF S&R Chart" title="USD/CHF S&R Chart" width="474" height="242" />
USD/CAD
 USD/CAD Daily Chart" title="USD/CAD Daily Chart" width="474" height="242" />
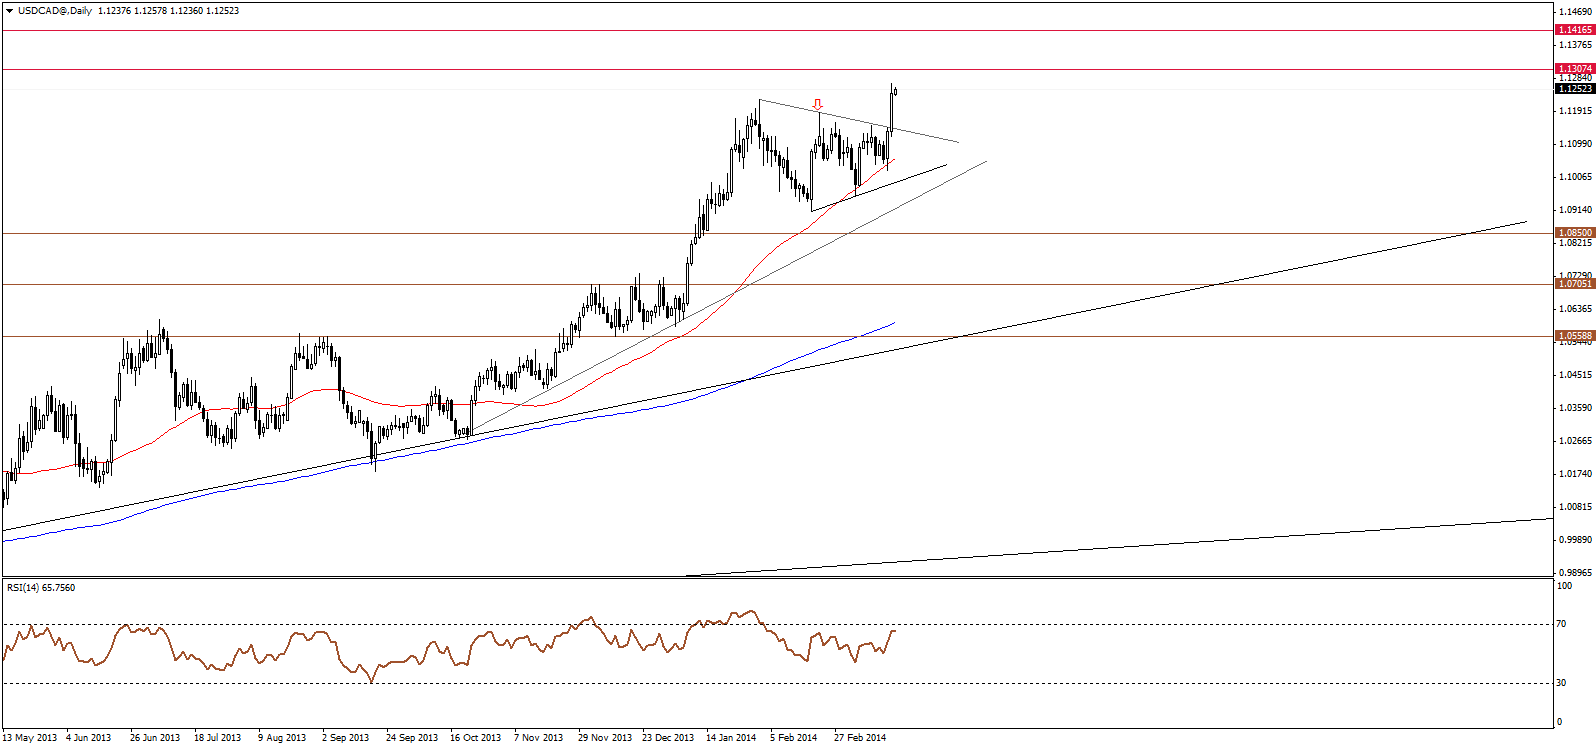
USDCAD rallies breaking the deseeding resistance for the symmetrical triangle formation and extending the upside to new highs above the latest major swing high at 1.1223, where the next near term target resides at 1.1305 area, followed by 1.1415. Holding above 1.1150 should keep the bullish wave intact.

AUD/USD
 AUD/USD Daily Chart" title="AUD/USD Daily Chart" width="474" height="242" />
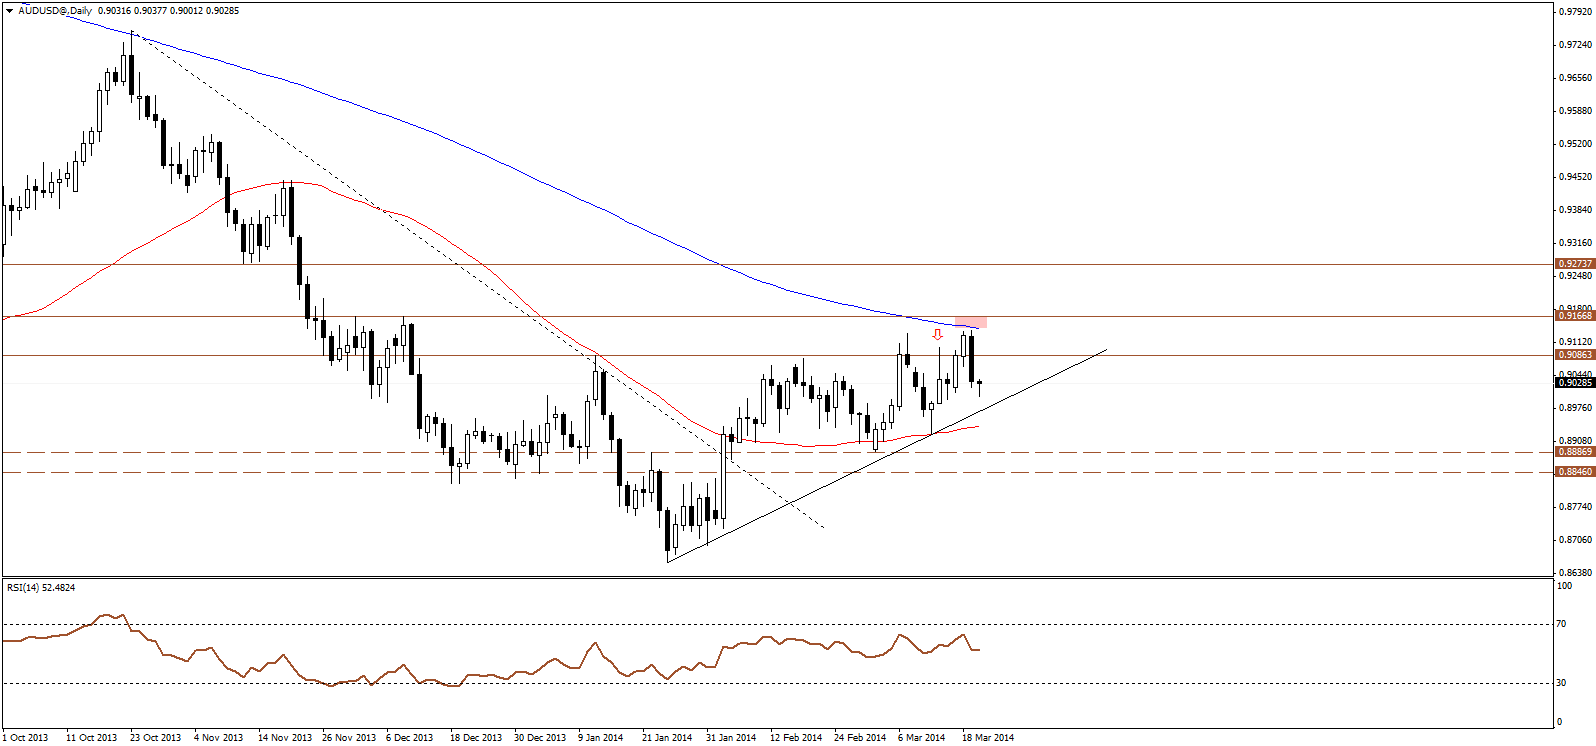
The AUD/USD retreated sharply yesterday, after testing areas near the major resistance of the 200-days SMA and 0.9160 horizontal level. The price formed a bearish engulfing candle, which hints the possibility of extending the bearish move, however price is facing the rising trend lien for the latest bullish wave, and accordingly, there still no confirmation for extending the bearishness.
 AUD/USD S&R Chart" title="AUD/USD S&R Chart" width="474" height="242" />
NZD/USD
 NZD/USD Daily Chart" title="NZD/USD Daily Chart" width="474" height="242" />
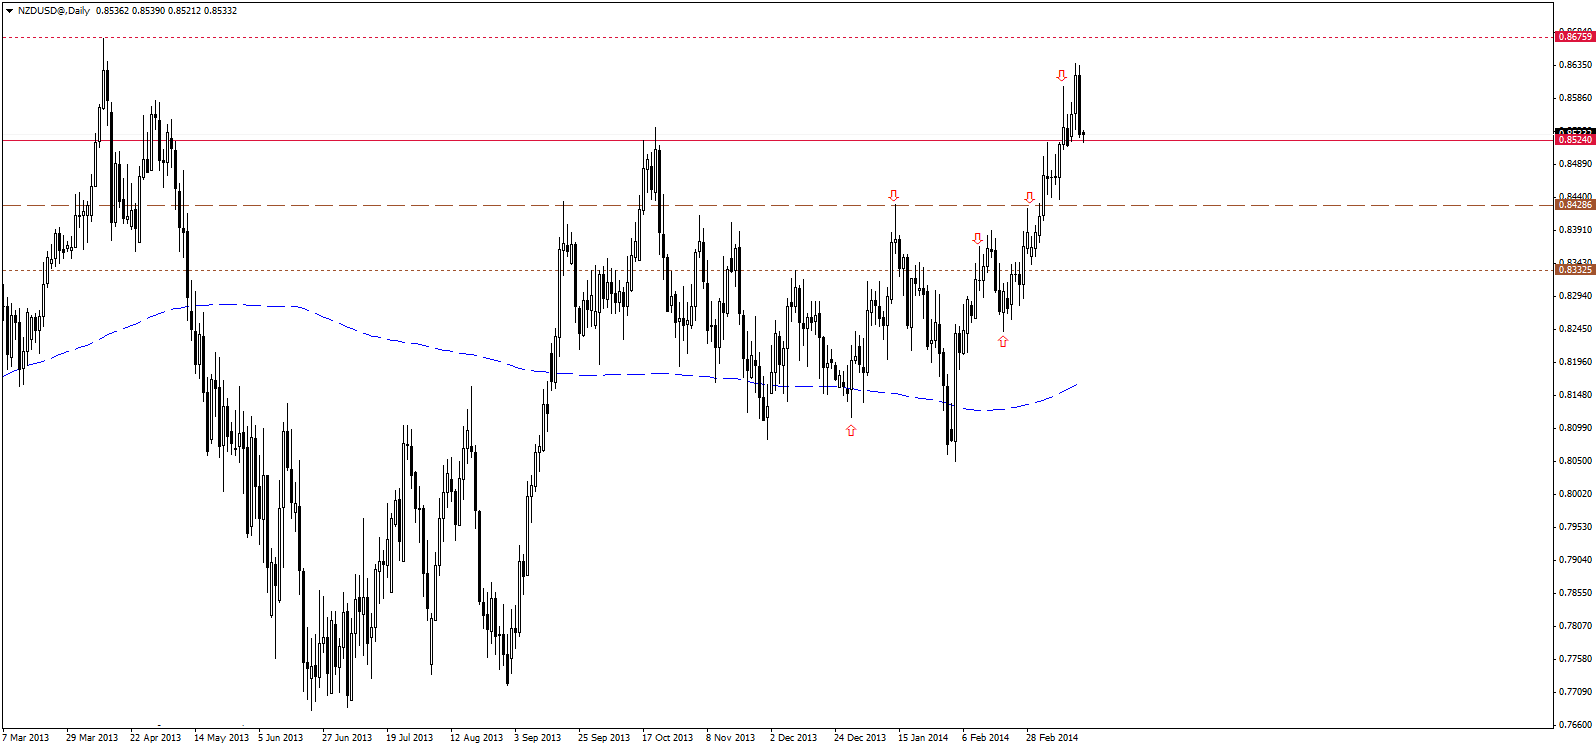
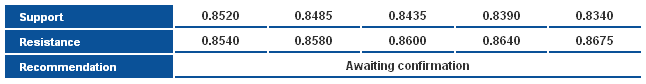
The NZD/USD fells sharply yesterday, retesting the major broken swing high at 0.8540 areas, and forming a major bearish candlestick formation, however, to confirm the downside reversal, we still need to see stability below 0.8520 support level. On the other hand we cant bet on the resumption of the bullish trend following the major bearish engulfing candle unless we see a clear confirmation signal over the lower time intervals.
 NZD/USD S&R Chart" title="NZD/USD S&R Chart" width="474" height="242" />