Get 40% Off
👀 👁 🧿 All eyes on Biogen, up +4,56% after posting earnings. Our AI picked it in March 2024.
Which stocks will surge next?
Unlock AI-picked Stocks

USD/SEK Technical Analysis For June 11, 2018

Published 06/11/2018, 04:27 AM
Updated 12/18/2019, 06:45 AM


Data on inflation for May will be published on June 14, 2018 in Sweden. Will USD/SEK fall?

Such a movement means the strengthening of the Swedish krona. Most market participants expect an increase in inflation to 1.9% in annual terms from 1.7% in April of the current year. Thus, it can come close to the target level of 2% set by the Swedish Central Bank (Riksbank). High inflation increases the probability of a rate hike, which is now minus 0.5% in Sweden. Last week, the First Deputy of Central Bank Kerstin af Jochnick expressed an opinion that the Swedish krona will be strengthened in the long run. The next Riksbank meeting will be held on July 3, 2018. In April, representatives of the Central Bank said that the rate be raised at the end of this year. The tightening of the monetary policy can support the rate of the Swedish krona.

USDSEK

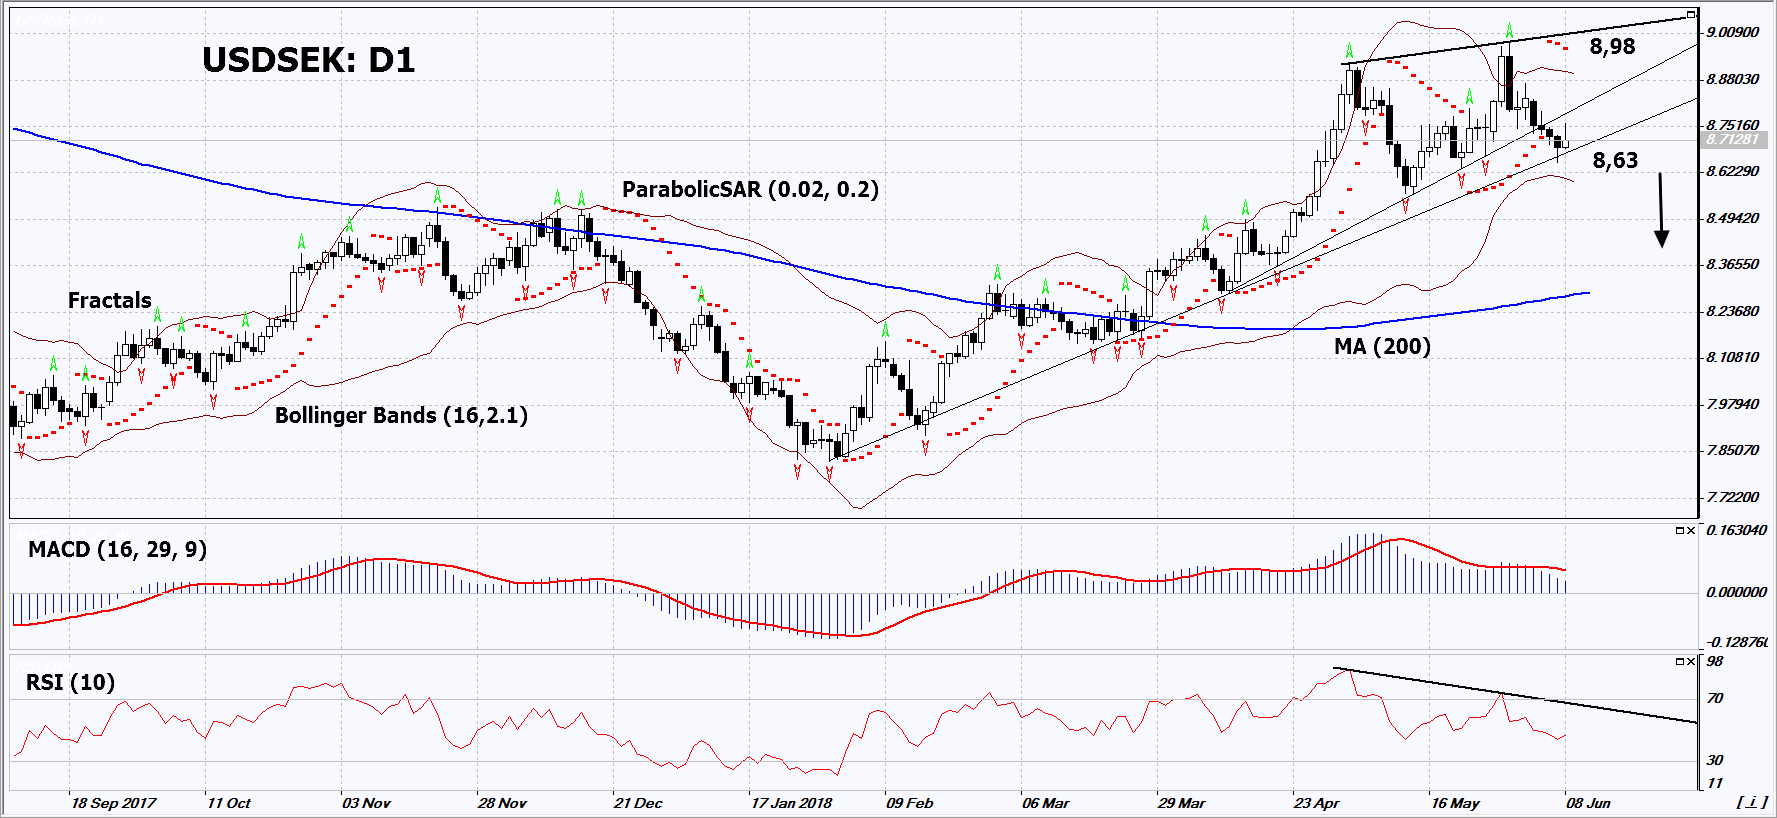
On the daily timeframe, USD/SEK: D1 approached the second support line of the uptrend. Before opening a sell position, it should be breached down. Investors’ expectations of a rate hike by the Swedish Central Bank can contribute to the decrease of the currency pair.

  • The Parabolic indicator gives a bearish signal.
  • The Bollinger bands have narrowed, which indicates low volatility. They are titled down.
  • The RSI indicator is below 50. It has formed a negative divergence.
  • The MACD indicator gives bearish signals.

The bearish momentum may develop in case USD/SEK falls below the two last fractal lows at 8.63. This level may serve as an entry point. The initial stop loss may be placed above the two last fractal highs, the 14-month high, the upper Bollinger band and the Parabolic signal at 8.98. After opening the pending order, we shall move the stop to the next fractal high following the Bollinger and Parabolic signals. Thus, we are changing the potential profit/loss to the breakeven point. More risk-averse traders may switch to the 4-hour chart after the trade and place there a stop loss moving it in the direction of the trade. If the price meets the stop level at 8.98 without reaching the order at 8.63, we recommend to close the position: the market sustains internal changes that were not taken into account.

3rd party Ad. Not an offer or recommendation by Investing.com. See disclosure here or remove ads .

Summary of technical analysis

Position Sell
Sell stop Below 8.63
Stop loss Above 8.98

Latest comments

Risk Disclosure: Trading in financial instruments and/or cryptocurrencies involves high risks including the risk of losing some, or all, of your investment amount, and may not be suitable for all investors. Prices of cryptocurrencies are extremely volatile and may be affected by external factors such as financial, regulatory or political events. Trading on margin increases the financial risks.
Before deciding to trade in financial instrument or cryptocurrencies you should be fully informed of the risks and costs associated with trading the financial markets, carefully consider your investment objectives, level of experience, and risk appetite, and seek professional advice where needed.
Fusion Media would like to remind you that the data contained in this website is not necessarily real-time nor accurate. The data and prices on the website are not necessarily provided by any market or exchange, but may be provided by market makers, and so prices may not be accurate and may differ from the actual price at any given market, meaning prices are indicative and not appropriate for trading purposes. Fusion Media and any provider of the data contained in this website will not accept liability for any loss or damage as a result of your trading, or your reliance on the information contained within this website.
It is prohibited to use, store, reproduce, display, modify, transmit or distribute the data contained in this website without the explicit prior written permission of Fusion Media and/or the data provider. All intellectual property rights are reserved by the providers and/or the exchange providing the data contained in this website.
Fusion Media may be compensated by the advertisers that appear on the website, based on your interaction with the advertisements or advertisers.
© 2007-2024 - Fusion Media Limited. All Rights Reserved.