Tilray (NASDAQ:TLRY)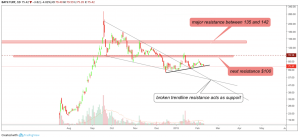
Weekly Chart – Chart created with Tradingview
Canadian cannabis producer Tilray was rejected by the resistance at $100 and formed a series of higher lows since then. Due to the fact that the trendline resistance was broken, it turned into a support which successfully held. The trendline support of the falling wedge pattern, which is around $60, acts as additional support.
Aurora Cannabis (TO:ACB)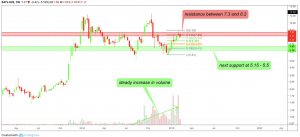
Weekly Chart – Chart created with Tradingview
Aurora successfully bounced off the support at around $5 and rose all the way up to the $8 mark, where it then faced rejection by the resistance. The steady increase in volume during the sideways movement is a bullish sign. Due to a bearish divergence in the daily RSI, it seems very likely that a correction wave will take place. Aurora will most likely decline to the golden pocket zone at $6. Assuming bullishness, a bounce off this mark and a continuation of the uptrend is likely. If it does not bounce, it will find its next support at around $5.
Canopy Growth Corporation (NYSE:CGC)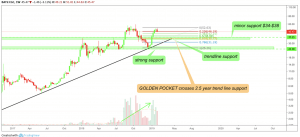
Weekly Chart – Chart created with Tradingview
Canopy surged incredibly since my last analysis and shelters an amazing trading opportunity right now. Canopy will most likely decline to the support range at $14, which happens to be located at the golden pocket zone and, simultaneously, at the 2.5-year long trendline support. It is likely that the support between $12.5 and $14 will hold and result in a continuation of the uptrend. If not, the next support will be found at around $9.
Cronos Group (NASDAQ:CRON)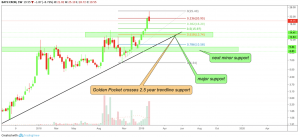
Weekly Chart – Chart created with Tradingview
Cronos is giving us a very similar setup. While the volume increased tremendously throughout the end of 2018 and the beginning of 2019, it seems likely that a small correction wave will take place. Cronos will most likely bounce off the golden pocket zone located at the support ranging from $34 to $38 where the 2.5-year trendline acts as additional, major support. If the triple-support fails to hold, the bullish setup is denied and Cronos will most likely decline to its next support at around $25.
GW Pharmaceuticals PLC ADR (NASDAQ:GWPH)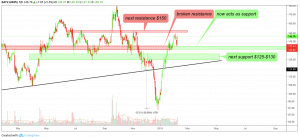
Weekly Chart – Chart created with Tradingview
GW Pharmaceuticals broke the resistance at $137 which now acts as support. After being rejected by the resistance at around $150, GW Pharmaceuticals quickly bounced off the newly established support at $137. That being said, it is ranging between support and resistance, which is a quite neutral setup.
The S&P 500 index surged by 13 percent since the beginning of the year whereas Cronos rose by an incredible 160 percent.
Moreover, at the time of writing, and according to the global market capitalization on Coinmarketcap, Bitcoin is currently located at around $3,600.
