Contraction in private sector bearish for HK50
Hong Kong’s private sector contraction continued in June. Will the HK50 decline?
Recent Hong Kong economic data were weak after the positive trade report three weeks ago showing the trade deficit in Hong Kong continued to decrease in May. Retail sales continued to fall in May albeit at a slower pace than in April: 1.7% over year versus 5% in April. And the June reading of purchasing managers index was below 50 again, indicating contraction in the private sector. Activities in private sector contracted for the fifteenth straight month as new orders dropped, pointing to weakness ahead too. The slump in activities is being attributed to US-China trade tensions, and there are no indications the dispute can be resolved soon. On Tuesday President Trump said he could impose tariffs on another $325 billion of imports from China after telling US and China ‘had long way to go’ before a deal. Continuing decline in activities in private business sector is bearish for HK 50.

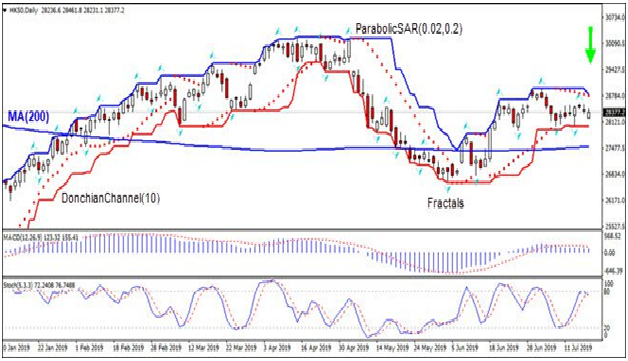
On the daily timeframe HK50: D1 is retracing lower after rebound following the decline to 8-month low in the beginning of May.
- The Parabolic indicator gives a sell signal.
- The Donchian channel indicates downtrend: it is narrowing down.
- The MACD indicator is above the signal line with the gap narrowing. This is a bearish signal.
- The Stochastic oscillator is falling back from the overbought zone.
We believe the bearish momentum will continue after the price breaches below the lower Donchian boundary at 28021.3. This level can be used as an entry point for placing a pending order to sell. The stop loss can be placed below the lower Donchian boundary at 28830.7. After placing the pending order the stop loss is to be moved every day to the next fractal high, following Parabolic signals. Thus, we are changing the expected profit/loss ratio to the breakeven point. If the price meets the stop-loss level (28830.7) without reaching the order (28021.3) we recommend cancelling the order: the market sustains internal changes which were not taken into account.
Technical Analysis Summary
Position Sell Sell Stop Above 28021.3 Stop loss Below 28830.7
Market Overview
US stocks post back to back losses Beige Book reveals US growth little changed
US stock market retreat continued on Wednesday after mixed earnings reports and no news on US-China trade negotiations status chaneg . The S&P 500 fell 0.7% to 2984.42. The Dow Jones industrial average slid 0.4% to 27219.85. Nasdaq composite index lost 0.5% to 8185.213. The dollar strengthening reversed as Beige Book survey released by the Federal Reserve showed the economy expanded at modest pace from mid-May through early July, little changed from the spring. The live dollar index data show the ICE (NYSE:ICE) US Dollar index, a measure of the dollar’s strength against a basket of six rival currencies, slipped 0.2% to 97.18 and is lower currently. Stock index futures point to lower market openings today
CAC 40 leads European indexes pullback
European stocks pulled back on Wednesday despite inflation data showing improvement for June. Both EUR/USD and GBP/USD’s turned higher with both pairs rising currently. The Stoxx Europe 600 lost 0.4% led by energy shares. Germany’s DAX 30 slumped 0.7% to 12341.03. France’s CAC 40 fell 0.8% and UK’s FTSE 100 slid 0.6% to 7535.46 as UK inflation remained at 2%.
Nikkei leads Asian indexes losses
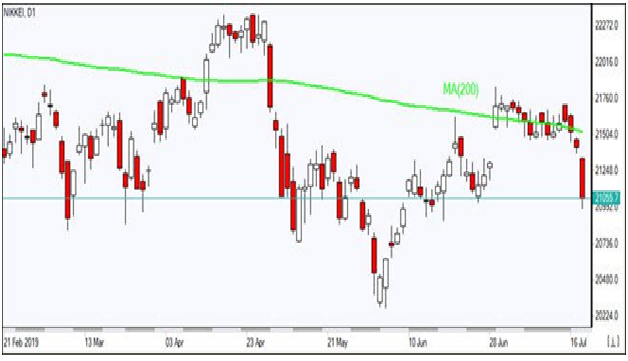
Asian stock indices retreat accelerated today on slew of weak data. Nikkei dropped 2% to 21046.24 with yen continuing its climb against the dollar despite report June exports fell for the seventh straight month. Chinese stocks are falling: the Shanghai Composite Index is down 1% and Hong Kong’s Hang Seng Index is 0.6% lower. Australia’s All Ordinaries Index turned 0.4% lower as Australian dollar resumed its climb against the greenback as unemployment remained unchanged.

Brent little changed after fifth straight weekly decline is US inventories
Brent futures prices are inching higher today. Prices fell yesterday after the Energy Information Administration report US crude inventories dropped by less than expected 3.1 million barrels last week while gasoline inventories rose by 3.6 million. September Brent crude lost 1.1% to $63.66 a barrel on Wednesday.
