
The oil price in Rubles has markedly deviated from its average value
In this review, we suggest considering the personal composite instrument (PCI) "BRENT oil vs the Ruble". It reflects the dynamics of the price change of a barrel of Brent crude oil against the Russian currency. Will the Brent/RUB quotes drop?
The PCI declines when oil prices decrease, while the Ruble strengthens against the US dollar, and, vice versa, the PCI advances when oil prices increase, while the Ruble falls. Such trends, as a rule, do not last long. The fact is that the relative weight of fuel and energy products in the Russian exports is traditionally high. In January-September 2017, it amounted to 65.2% in the non-CIS countries (62.5% in January-September 2016). Increasing oil prices strengthen the Ruble against the US dollar and vice versa. As a result, the BRENT/RUB chart tends to oscillate around its average line. Currently it has markedly deviated from it and, theoretically, there may be a downward correction. An unusually strong growth of the PCI was contributed by the growth of the world oil prices by more than a quarter in the 2-nd half-year of this year. OPEC and independent producers formally extended the oil production limitation until the end of 2018. However, this agreement will be revised already in June. Thus, the restriction may only function in the first half of the year, which is a negative factor for oil quotes. To reduce the given PCI, it is optative for the Ruble to strengthen. The reasons for this are not so many. The main one is the significant foreign exchange reserves of the Central Bank of Russia. Currently, they amount to about $430 bln. At an exchange rate of 60 Rubles. per one US dollar, the Russian foreign exchange reserves are by only 35% less than the entire M2 money supply and about 3 times more than all the cash in circulation in Russia.
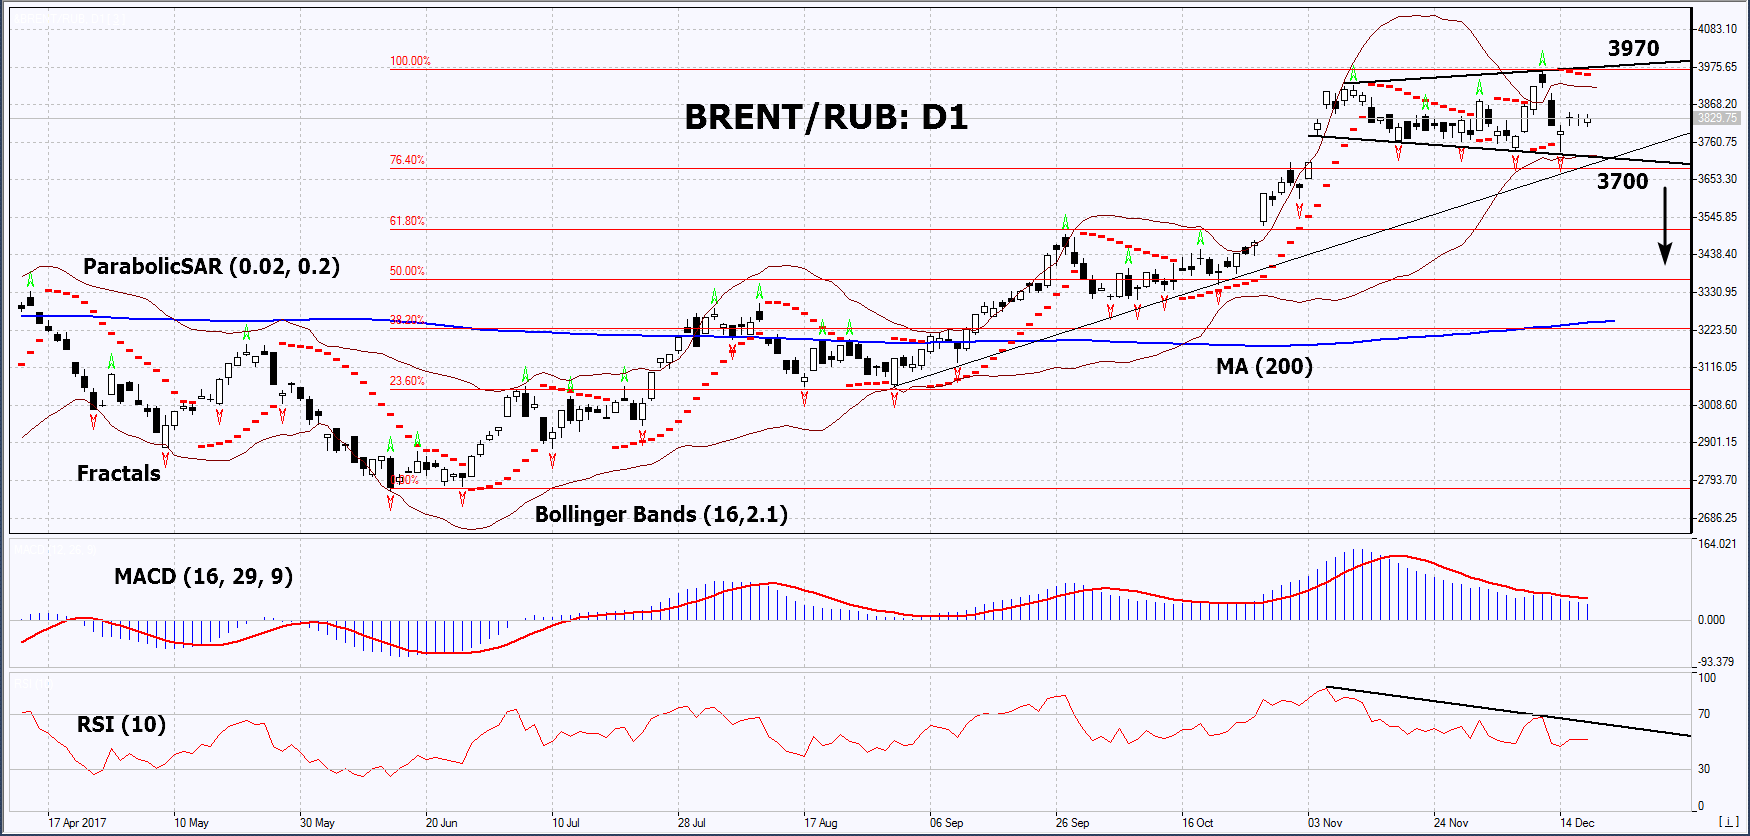
On the daily timeframe, BRENT/RUB: D1 switched to the short-term neutral trend. The technical analysis indicators have formed Sell signals. A downward correction is possible in case of the publication of positive economic information in Russia, as well as in case of an increase in the world oil production and a decrease in its price.
- The Parabolic indicator gives a bearish signal.
- The Bollinger bands have markedly narrowed, which means lower volatility. They are tilted down.
- The RSI indicator is above 50. It has formed a negative divergence.
- The MACD indicator gives a bearish signal.
The bearish momentum may develop in case BRENT/RUB drops below the last fractal low, the lower Bollinger band and the support line of the neutral trend at 3700. This level may serve as an entry point. The initial stop loss may be placed above the last fractal high, the 2.5-year high, the upper Bollinger band and the Parabolic signal at 3970. After opening the pending order, we shall move the stop to the next fractal high following the Bollinger and Parabolic signals. Thus, we are changing the potential profit/loss to the breakeven point. More risk-averse traders may switch to the 4-hour chart after the trade and place there a stop loss moving it in the direction of the trade. If the price meets the stop level at 3970 without reaching the order at 3700, we recommend cancelling the position: the market sustains internal changes that were not taken into account.
Summary of technical analysis
Position - Sell
Sell stop - below 3700
Stop loss - above 3970