Gold prices rise against the background of the Middle East crisis
In this review, we recommend considering the personal composite instrument (PCI) Gold against the Russian ruble. It reflects the dynamics of gold prices expressed in Russian rubles. The PCI increases in case of the weakening of the Russian ruble and an increase in gold prices on the world market.
The main factor for the possible weakening of the ruble is the expected key rate cut by the Central Bank of the Russian Federation at the next meeting on June 16, 2017. It may be 0.25% or 0.5%. Additional factors are the plans to purchase a foreign currency by the Russian Ministry of Finance and the Central Bank to increase foreign exchange reserves.
The political crisis in the Middle East because of the situation in Qatar may contribute to the growth of world gold prices. A number of Arab countries severed diplomatic relations with Qatar. In addition, the investigation of actions of President Donald Trump’s campaign headquarters will continue in the USA, which can also increase political risks and demand for gold.

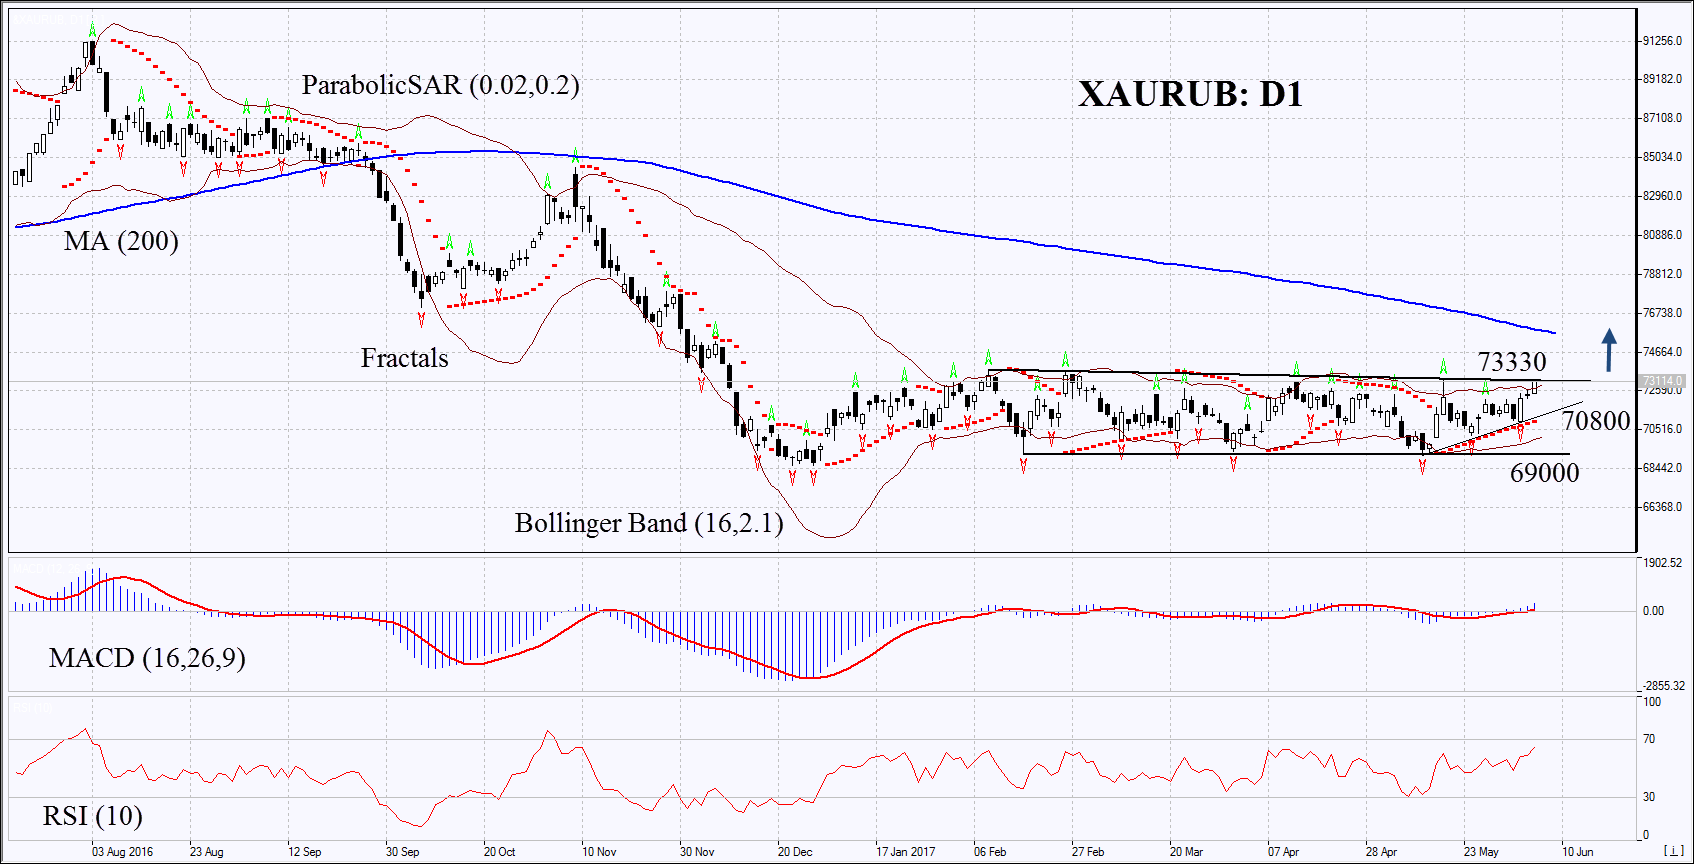
On the daily timeframe, XAU/RUB: D1 is in a neutral trend. In order to open a buy position, the prices should exit from it to the top. The further price increase is possible in case of the strengthening of conflicts in the Middle East and USA, as well as in case of the further rate cut by the Central Bank of the Russian Federation.
- The Parabolic indicator gives a bullish signal.
- The Bollinger bands have narrowed, which indicates a low volatility. They are titled upward.
- The RSI indicator is above 50. No divergence.
- The MACD indicator gives a bullish signal.
The bullish momentum may develop in case XAURUB rises above the neutral range at 73330. This level may serve as an entry point. The initial stop loss may be placed below the last fractal low and the Parabolic signal at 70800. The most risk-averse traders may use the lower boundary of the neutral trend as a stop loss at 69000. After opening the pending order, we shall move the stop to the next fractal low following the Bollinger and Parabolic signals. Thus, we are changing the potential profit/loss to the breakeven point.
More risk-averse traders may switch to the 4-hour chart after the trade and place there a stop loss moving it in the direction of the trade. If the price meets the stop level at 70800 or 69000 without reaching the order at 73330 we recommend cancelling the position: the market sustains internal changes that were not taken into account.
Technical Analysis Summary
Position - Buy
Buy stop - Above 73330
Stop loss - Below 70800 или 69000
