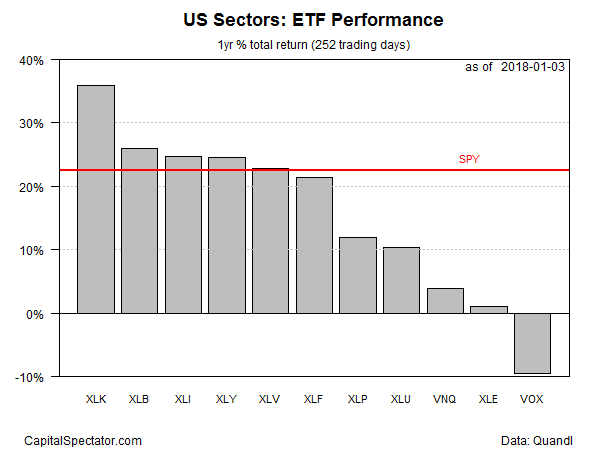
Technology shares continue to post the strongest trend performance for US equity sectors, based on a set of ETFs ranked by one-year return. Although most sectors are posting year-over-year gains, the annual pace for tech remains notable for its outsized advance vs. the rest of the field.
Technology Select Sector SPDR (NYSE:XLK) is up a strong 35.8% for the year through yesterday (Jan. 3). The current gain is close to the ETF’s highest one-year total return since the recession ended in 2009. (At one point in last year’s fourth quarter, XLK’s rolling one-year change briefly accelerated to just under 40%, a cyclical peak for the post-recession period.)
XLK’s current upside momentum for the one-year gain is well above the number-two performer: stocks in the materials sector. The Materials Select Sector SPDR (NYSE:XLB) is up 25.9% on a total return basis over the past 12 months – a solid increase, but no match for tech’s surge.
Although all but one of the 11 sectors are posting one-year gains, only five are beating the broad market, based on the SPDR S&P 500 (MX:SPY (NYSE:SPY)), which is currently posting a 22.4% total return for the trailing one-year period.
The lone sector with a negative one-year trend at the moment: telecom. The Vanguard Telecommunication Services (NYSE:VOX) was down 9.5% at yesterday’s close vs. the year-earlier level. In fact, VOX’s rolling one-year total return has been consistently negative every day since Dec. 5.

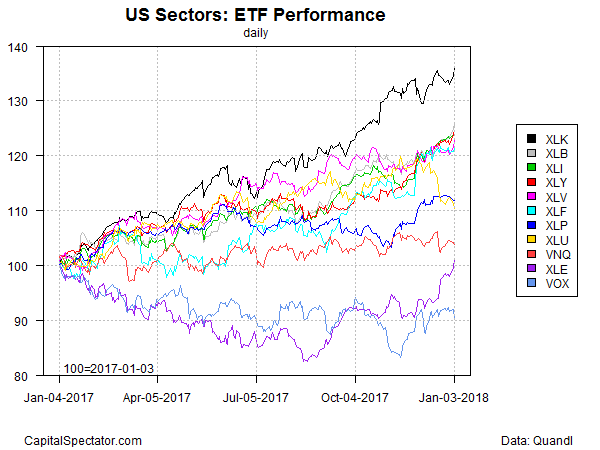
The performance chart below presents a visual summary of tech’s dominance in recent history. Although most sector trends are positive, XLK’s run (black line at top of graph) stands apart as unusually bullish.

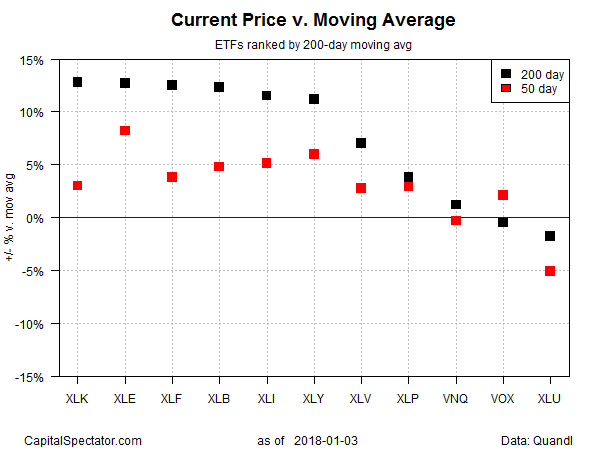
Ranking the sector ETFs by current price relative to 200-day moving average reveals a more egalitarian profile. Although XLK’s latest price has the biggest premium over its 200-day average (12.8%), five other sectors are in close pursuit on that score. Note, too, that energy (XLE (NYSE:XLE)) is the current leader for the biggest premium over the 50-day average — is that a sign that the sector’s modest one-year gain (a thin 1.1%) is poised to rise in the months ahead?

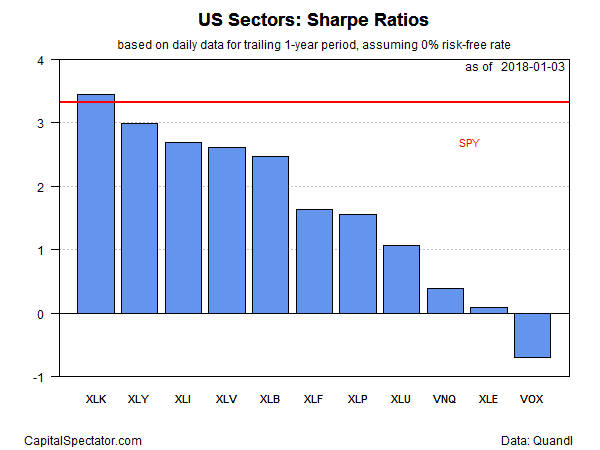
Tech holds the lead in risk-adjusted terms for the trailing one-year period. XLK’s 3.4 Sharpe ratio (SR) for the past 12 months is modestly ahead of the second-highest SR for sector for the past year: 3.0 for the Consumer Discretionary Select Sector SPDR (NYSE:XLY). Meantime, the broad market’s risk-adjusted score: 3.3 for SPY, which is only slightly below tech’s Sharpe ratio.

For additional research on the sector ETFs cited above, here are links to the summary pages at Morningstar.com:
Consumer Discretionary (XLY)
Consumer Staples (XLP)
Energy (XLE)
Financial (XLF)
Healthcare (XLV)
Industrial (XLI)
Materials (XLB)
Technology (XLK)
Utilities (XLU)
Telecom (VOX)
Real Estate Investment Trusts (VNQ)
