
TE Connectivity Ltd. (NYSE:TEL) scored its sixth consecutive earnings beat as it reported second-quarter fiscal 2017 adjusted earnings of $1.19 per share, beating the Zacks Consensus Estimate of $1.08 by 10.2%.
The bottom line fared phenomenally in year-over-year comparison, surging 32% from the prior-year tally of 90 cents. The figure also steered past the projected range of $1.05–$1.09.
The impressive earnings were driven by continued progress on strategic priorities, solid execution and an impressive top-line growth.
On GAAP basis, the company’s earnings from continuing operations came in at $1.13 per share, up 7% from $1.06 reported in the year-ago quarter.
Inside the Headlines
Net sales in the quarter grew 9.0% year over year at $3,227 million, and also topped the Zacks Consensus Estimate of $3,080 million. Solid performance across all three segments drove the quarterly top-line growth. Excellent traction in the company’s harsh environment businesses, which has been a staple profit churner over the past quarters, contributed significantly to the top line.
Segmental Performance
Transportation Solutions revenues came in at $1,755 million in the quarter, up 9% on a year-over-year basis. Orders in the transportation segment came in at $1,811 million, up 17% on a year over year basis. Automotive organic sales growth in Asia and Europe, Middle East and Africa (“EMEA”) regions acted as tailwinds.
Also, rebound in heavy truck market and impressive electronic content sales from regulation changes proved conducive to organic growth of the Commercial Transportation business. Moreover, recovery of Industrial markets added to sales growth of this segment.
Industrial Solutions revenues had another stellar quarter, rising 16% year over year to $853 million. Orders in this quarter rose 22% to $927 million. The impressive growth was driven by organic growth in Defense business, decent energy business in EMEA and Asia and robust Industrial Equipment organic growth. Also, the previously completed Creganna and Intercontec acquisitions contributed significantly to growth.
Communications Solutions revenues rose 2% year over year to $619 million. Orders were up 6% year over year to $446 million. Growth of this segment is driven by robust performance of Data & Devices and double digit appliances growth in Asia.
The company’s adjusted operating margin for the quarter expanded 170 basis points from the year-ago quarter to 16.6%.
TE Connectivity Ltd. Price, Consensus and EPS Surprise
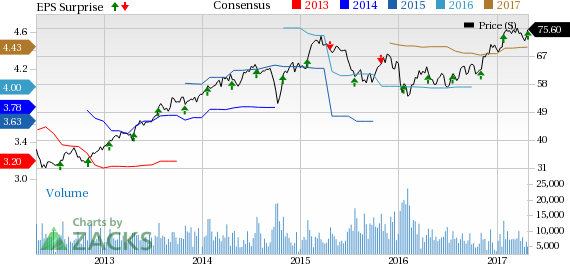
TE Connectivity Ltd. Price, Consensus and EPS Surprise | TE Connectivity Ltd. Quote
Liquidity & Cash Flow
TE Connectivity exited the quarter with cash and cash equivalents of $773 million, significantly lower than $1,150 million a year back.
The company generated free cash flow of $387 million in the quarter, up from $209 million in the prior-year quarter.
Share Repurchase Program/Dividend
During the reported quarter, the company returned $234 million to shareholders through dividends and share repurchases.
Guidance
TE Connectivity projects third-quarter fiscal 2017 adjusted earnings per share in the range of $1.14–$1.18 (representing 7% year-over-year growth at mid-point). It expects revenues to lie in the range of $3.2–$3.3 billion, (which reflects growth of 4% year over year at mid-point).
Concurrent with the fiscal second-quarter earnings release, the company raised its fiscal 2017 earnings and revenue guidance. It now expects net sales in the range of $12.6–$12.8 billion, compared with the earlier range of $12.2–$12.6 billion. It reflects 6% year-over-year growth at mid-point. Adjusted earnings per share are projected in the band of $4.58–$4.66, as opposed to the earlier guidance of $4.30–$4.50. It reflects 17% year-over-year growth at mid-point.
To Conclude
TEL Connectivity came up with yet another impressive quarter with strong top and bottom-line beats. The company’s 2017 bottom-line guidance hike, second time in a row, and robust sales forecast are likely to go very well with investors. Most of the company’s operating margin expansion in the past few years have been driven by the transportation segment.
Encouragingly, in recent times we observed that both the Communications and Industrial segments are contributing significantly to the operating margin expansion, thus adding to the company’s strength. Going forward, we believe the previously completed Creganna and Intercontec acquisitions will continue to unlock significant opportunities in the transportation and industrial segments. Overall, we believe strong demand in end markets, along with an overarching business model, will continue to drive TEL Connectivity’s future growth.
Other Stocks to Consider
TEL Connectivity has a Zacks Rank #2 (Buy). Some other top-ranked stocks in the broader sector include Motorola Solutions, Inc. (NYSE:MSI) , PCTEL, Inc. (NASDAQ:PCTI) and NCR Corp. (NYSE:NCR) . While PC-Tel sports a Zacks Rank #1, Motorola and NCR Corp. hold the same Zacks Rank as TE Connectivity. You can see the complete list of today’s Zacks #1 Rank stocks here.
PC-Tel generated three massive beats in the trailing four quarters, for an average positive surprise of 125.0%.
Motorola has a striking earnings surprise history for the last four quarters, beating estimates all through, for an impressive average beat of 16.4%.
NCR also has an excellent earnings surprise history, with an average beat of 11.0% for the trailing four quarters, beating estimates all through.
Looking for Ideas with Even Greater Upside?
Today's investment ideas are short-term, directly based on our proven 1 to 3 month indicator. In addition, I invite you to consider our long-term opportunities. These rare trades look to start fast with strong Zacks Ranks, but carry through with double and triple-digit profit potential. Starting now, you can look inside our home run, value, and stocks under $10 portfolios, plus more.
Click here for a peek at this private information >>
NCR Corporation (NCR): Free Stock Analysis Report
Motorola Solutions, Inc. (MSI): Free Stock Analysis Report
PC-Tel, Inc. (PCTI): Free Stock Analysis Report
TE Connectivity Ltd. (TEL): Free Stock Analysis Report
Original post
Zacks Investment Research