
Shares of TCF Financial Corporation (NYSE:TCF) gained 1.2% post delivering second-quarter 2019 positive earnings surprise of 14.3%. Adjusted earnings per share of 56 cents surpassed the Zacks Consensus Estimate of 49 cents. Further, the bottom line was nearly 14% up from the prior-year quarter.
Second-quarter results benefited from decline in expenses and fall in provisions. Also, deposits balance improved. However, the company witnessed fall in top line. Further, contraction of margin and lower loans were other headwinds.
TCF Financial reported net income of $90.4 million for the quarter, up 53.9% from $73.8 million in the year-ago quarter.
Revenues & Loans Decline, Expenses Fall
Total revenues for the second quarter came in at $363.8 million, down slightly year over year. Also, the top line missed the Zacks Consensus Estimate of $367.7 million.
Net interest income for the quarter declined marginally year over year to $250.3 million. The fall stemmed from rise in interest expenses and decreased interest income on debt securities held to maturity. This was partially offset by rise in loans and leases held for investment, along with and debt securities available for sale.
Net interest margin of 4.43% contracted 24 basis points (bps) year over year due to higher average rates on deposits. This was partly offset by rise in average yields on the variable and adjustable-rate loan portfolios.
Non-interest income came in at $113.5 million, down nearly 1% on a year-over-year basis. This decrease primarily resulted from fall in almost all components of income, partially mitigated by higher card revenues and gains on sale of loans.
TCF Financial reported non-interest expenses of $236.8 million for the June-ended quarter, down 12.9% from the year-earlier quarter. The decline primarily resulted from lower compensation and employee benefits and other expenses.
As of Jun 30, 2019, deposits came in at $19.1 billion, up slightly from the prior-quarter end. However, total loans and leases declined 1% sequentially to $19.2 billion.
Credit Quality: A Mixed Bag
Total non-performing assets climbed 18.3% year over year to $121.6 million in the second quarter. Further, net charge-offs, as a percentage of average loans and leases, expanded 2 bps to 0.29%. The upsurge chiefly resulted from elevated net charge-offs in the commercial and inventory finance portfolios.
However, provisions for credit losses were $13.6 million, down 4.7% year over year.
Capital Position
As of Jun 30, 2019, Common equity Tier 1 capital ratio was 10.99% compared with 10.60% as of Jun 30, 2018. Also, total risk-based capital ratio was 13.41% compared with 13.22% on Jun 30, 2018. Tier 1 leverage capital ratio was 10.27% on Jun 30, 2019, down from 10.31%.
Our Viewpoint
Rise in deposits and lower provisions are likely to support near-term growth. In addition, controlled expenses are likely to keep stoking the bank’s bottom line. However, a weak top line keeps us apprehensive. Further, expectation of rate cuts later this year is a major concern.
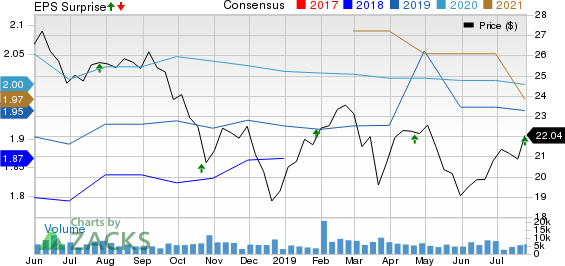
TCF Financial Corporation Price, Consensus and EPS Surprise
TCF Financial currently carries a Zacks Rank #4 (Sell).
You can see the complete list of today’s Zacks #1 Rank (Strong Buy) stocks here.
Performance of Other Banks
SEI Investments Co.’s (NASDAQ:SEIC) second-quarter 2019 earnings of 82 cents per share surpassed the Zacks Consensus Estimate of 79 cents. The figure reflected rise of 9.3% from the prior-year quarter.
Shares of BankUnited, Inc. (NYSE:BKU) gained 9.2%, following the release of second-quarter 2019 results. Its earnings per share of 81 cents surpassed the Zacks Consensus Estimate of 68 cents. However, the bottom line compared unfavorably with the prior-year quarter’s earnings of 82 cents.
Bank of Hawaii Corporation (NYSE:BOH) delivered a positive earnings surprise of 2.2% in second-quarter 2019, leading to an appreciation of 2.18% in shares, following the release. Earnings per share of $1.40 surpassed the Zacks Consensus Estimate of $1.37. Further, the reported figure compares favorably with $1.30 earned in the prior-year quarter.
Biggest Tech Breakthrough in a Generation
Be among the early investors in the new type of device that experts say could impact society as much as the discovery of electricity. Current technology will soon be outdated and replaced by these new devices. In the process, it’s expected to create 22 million jobs and generate $12.3 trillion in activity.
A select few stocks could skyrocket the most as rollout accelerates for this new tech. Early investors could see gains similar to buying Microsoft (NASDAQ:MSFT) in the 1990s. Zacks’ just-released special report reveals 7 stocks to watch. The report is only available for a limited time.
See 7 breakthrough stocks now>>
BankUnited, Inc. (BKU): Free Stock Analysis Report
Bank of Hawaii Corporation (BOH): Free Stock Analysis Report
SEI Investments Company (SEIC): Free Stock Analysis Report
TCF Financial Corporation (TCF): Free Stock Analysis Report
Original post
Zacks Investment Research