The optimism in the markets that President Trump's tax reforms will be passed saw the markets trading higher. The U.S. dollar was trading mixed but the greenback managed to post gains against the weaker currencies such as the yen and the kiwi dollar.
OPEC managed to seal the deal as the oil producing nations agreed to extend the production cuts through the end of 2018. This sent oil prices higher with Nymex crude oil futures rising 0.2% while Brent oil futures rose 0.7% on the day.
In the Eurozone, the common currency fell as the flash inflation estimates showed that core inflation remained weak at 0.9%. This was despite the headline inflation coming out higher. However, the common currency quickly pared losses on hopes of positive coalition talks between the SPD and the CSU.
Looking ahead, the economic data today will see the monthly ISM manufacturing PMI data. Estimates show that manufacturing activity fell to 58.4 from 58.7 previously. Canadian monthly GDP report and unemployment data is expected as well.
EUR/USD intra-day analysis

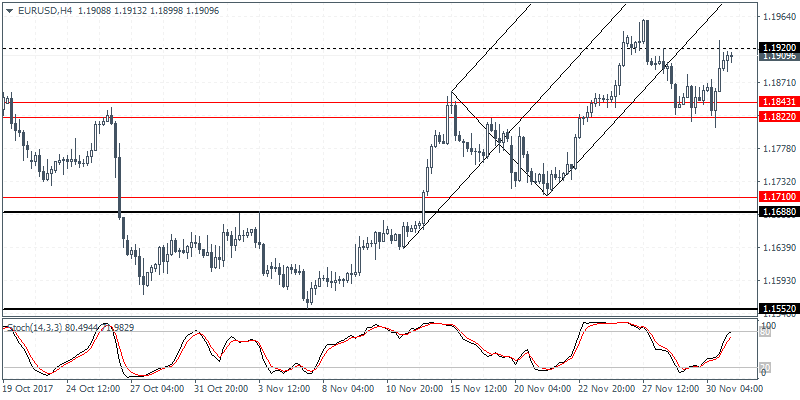
EUR/USD (1.1909): The EUR/USD was volatile yesterday as price action initially slipped to a 6-day low before recovering. The declines came as the flash inflation estimates came out lower than forecasts for the Eurozone. The EUR/USD formed an inside bar on the daily session which could now see a potential breakout from the ranging price action. On the 4-hour chart, price action briefly tested the resistance level at 1.1920 as expected. We expect to see the euro maintaining a sideways range within 1.1920 resistance and 1.1822 support region in the short term. A breakout from this range will potentially establish further direction in the currency pair. The risk is however to the downside as the common currency could fall towards the lower support at 1.1710 on a downside breakout.
USD/JPY intra-day analysis

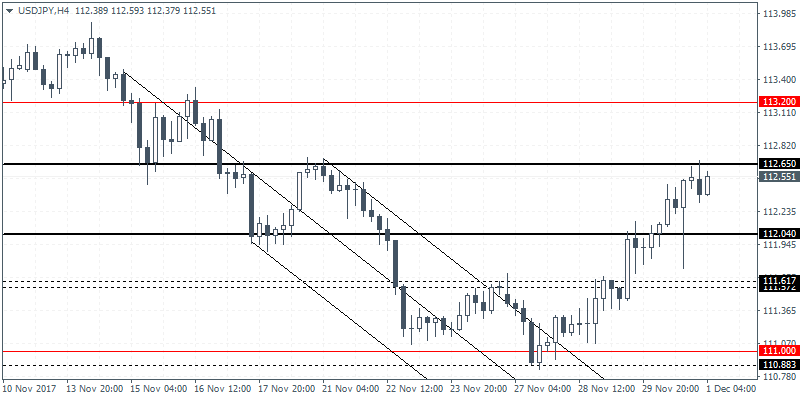
USD/JPY (112.55): The USD/JPY managed to keep its gains for the third consecutive day. The reversal just above 110.70 level of support could see price action currently testing the previous resistance level near 112.65. In the short term, USD/JPY could remain range bound within 112.65 and 112.04 levels. A breakout above 112.65 will be bullish as the currency pair could be seen rallying to the 113.20 level where the next resistance could be tested. To the downside, USD/JPY could be at risk of a decline back to 111.61 level. Further declines are likely to be limited for the moment.
XAU/USD intra-day analysis

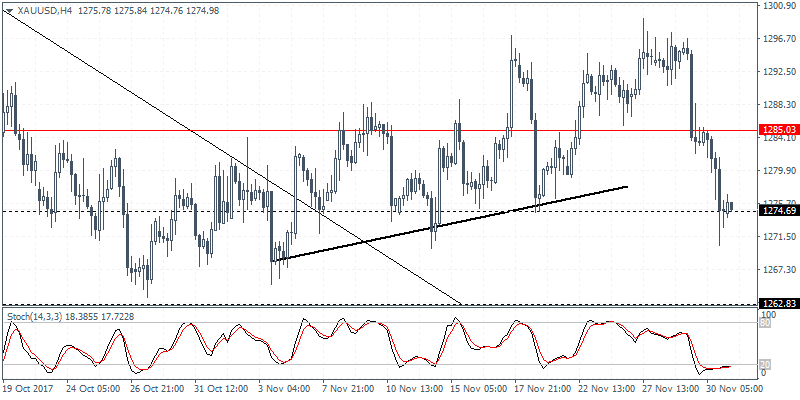
XAU/USD (1274.98): Gold prices failed near to hold near the support level of 1285. As a result, price action fell sharply back to the previous support level near 1274.70 region. We expect that this support level will hold in the near term. The upside is limited as gold prices could be seen rallying back to 1285 to establish resistance near this level. To the downside, there is risk of a decline below 1274.70. In this case, gold prices could be pushing lower to test the 1262 level of support.
