
Despite tough retail landscape, Tapestry, Inc. (NYSE:TPR) posted better-than-expected first-quarter fiscal 2018 bottom-line results. The adjusted earnings of 42 cents a share beat the Zacks Consensus Estimate of 36 cents, thereby resulting in a positive earnings surprise of 16.7% and marking the 15th straight quarter of earnings beat. However, the quarterly earnings declined roughly 6.7% year over year due to higher SG&A expenses. Even an increase in top line failed to act as a savior.
Net sales of this New York-based company came in at $1,288.9 million, up 24% year over year. On a constant currency basis, net sales rose 25%. However, we noted that the total sales fell short of the Zacks Consensus Estimate of $1,304 million for the fifth successive quarter.
Nonetheless, Tapestry is undergoing a brand transformation and is introducing modern luxury concept stores in key markets. The acquisition of Stuart Weitzman and Kate Spade & Company is being viewed as a significant step in its efforts toward becoming a multi-brand company. Moreover, management has undertaken transformation initiatives revolving around product, stores and marketing. These endeavors have aided the stock to rise 18.4% so far in the year compared with the industry that declined 2.6%.
Consolidated adjusted gross profit surged 19.3% to $852.8 million, however, gross margin contracted 270 basis points to 66.2%. Adjusted operating income came in at $168.8 million, down 4.5% from the prior-year quarter figure, while operating margin shriveled 390 basis points to 13.1%.

Segment Details
Net sales for Coach declined 3% year over year to $923.7 million, while on a constant currency basis, the same slid 2%. Comparable-store sales fell 2% due to shift in timing of the Chinese Mid-Autumn festival into October, inventory challenges and disruptions caused by hurricanes.
Kate Spade sales came in at $268.8 million. Comparable-store sales declined 9%, including the adverse impact of about 600 basis points from a fall in global e-commerce. Net sales for Stuart Weitzman totaled $96.4 million, reflecting an increase of 10%.
Tapestry, Inc. Price, Consensus and EPS Surprise
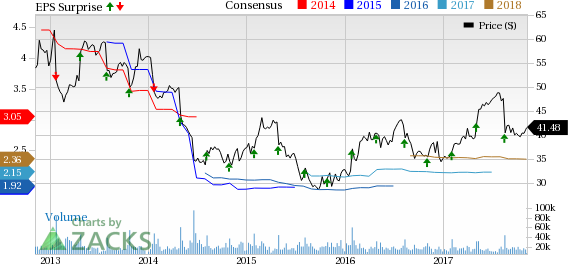
Tapestry, Inc. Price, Consensus and EPS Surprise | Tapestry, Inc. Quote
Store Update
At the end of the quarter, the company operated 417 Coach stores, 183 Kate Spade outlets and 69 Stuart Weitzman stores in North America. Internationally, the count stood at 543, 93 and 12 for Coach, Kate Spade and Stuart Weitzman, respectively.
Other Financial Details
Tapestry, which carries a Zacks Rank #3 (Hold), ended the quarter with cash, cash equivalents and short-term investments of $1,670.9 million, long-term debt of $1,888.2 million and shareholders' equity of $2,940 million.
Guidance
Management continues to expect fiscal 2018 revenue to increase approximately 30% year over year to $5.8-$5.9 billion with low-single digit organic growth and Kate Spade acquisition adding more than $1.2 billion in revenue. The company maintains earnings projection of $2.35-$2.40 per share, reflecting an increase of approximately 10-12%, comprising low-to-mid-single digit accretion from the Kate Spade buyout.
Tapestry projects operating income growth in the band of 22-25% on the back of mid-single digit organic growth, Kate Spade buyout and estimated synergies of $30-$35 million. Interest expense is now expected to be about $80-$85 million for the fiscal year.
Interested in the Retail Space? Check Out These
Zumiez Inc. (NASDAQ:ZUMZ) delivered an average positive earnings surprise of 27.1% in the trailing four quarters. The company has a long-term earnings growth rate of 18% and sports a Zacks Rank #1 (Strong Buy). You can see the complete list of today’s Zacks #1 Rank stocks here.
Burlington Stores, Inc. (NYSE:BURL) has a long-term earnings growth rate of 17.4% and carries a Zacks Rank #2 (Buy).
The Home Depot, Inc. (NYSE:HD) delivered an average positive earnings surprise of 3.8% in the trailing four quarters. It has a long-term earnings growth rate of 13.5% and carries a Zacks Rank #2.
Zacks' Hidden Trades
While we share many recommendations and ideas with the public, certain moves are hidden from everyone but selected members of our portfolio services. Would you like to peek behind the curtain today and view them?
Starting now, for the next month, I invite you to follow all Zacks' private buys and sells in real time from value to momentum...from stocks under $10 to ETF to option movers...from insider trades to companies that are about to report positive earnings surprises (we've called them with 80%+ accuracy). You can even look inside portfolios so exclusive that they are normally closed to new investors.
Click here for Zacks' secret trade>>
Home Depot, Inc. (The) (HD): Free Stock Analysis Report
Zumiez Inc. (ZUMZ): Free Stock Analysis Report
Burlington Stores, Inc. (BURL): Free Stock Analysis Report
G-III Apparel Group, LTD. (GIII): Free Stock Analysis Report
Tapestry, Inc. (TPR): Free Stock Analysis Report
Original post
Zacks Investment Research