1.Crude oil after rallying to 53,74$ came back down to 48,85$.
2.Expectations for O.P.E.C deal extension is rising.
3.Geopolitical tensions are favoring Crude Oil's price.
4.Amid forecasts inventories are expected to record a drop of 1.3 million barrels.
Opec and other exporters including Russia agreed last year to cut output by 1,8 million barrels per day (bpd) to reduce a price-sapping glut. The deal took effect on January and lasts six months. Despite most O.P.E.C members appear to be sticking to the deal so far it is unclear how much impact the supply reductions have on world oil inventories,which are close to record highs.
Taking this into consideration there is a good chance and high odds that O.P.E.C will decide to continue this process. A final decision on whether or not to extend the deal beyond June will be taken by the oil cartel on May 25.
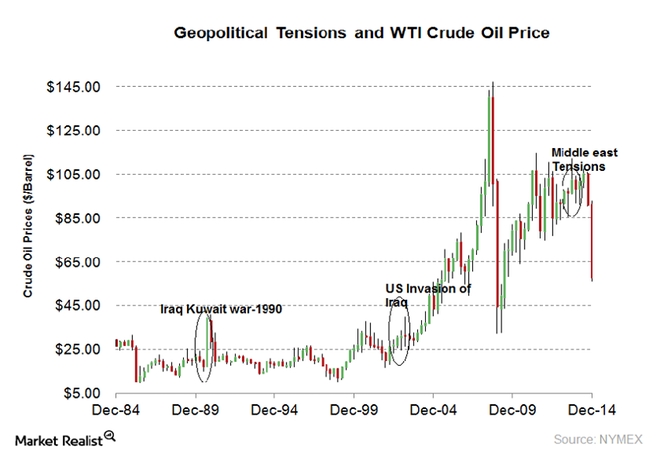
Geopolitical tensions impact crude oil prices.Political unrest affects production and reduced supply.The consensus of a shortage of oil supply leads to an increase in oil prices. As we can see at the chart below, in the past Crude Oil prices have risen through times of war conflicts because these geopolitical tensions tend to create supply disruptions and increased demand for oil. We all know the existing conflict between USA and Russia on Syria issue but also the disapproval of USA for nuclear tests of North Korea if we considered a possible thesis of China on this matter then we are talking about a few of the top oil producers of the world (1st Russia, 3rd USA, 5th China), any conflict between these countries will affect Oil prices heavily.
TECHNICALLY
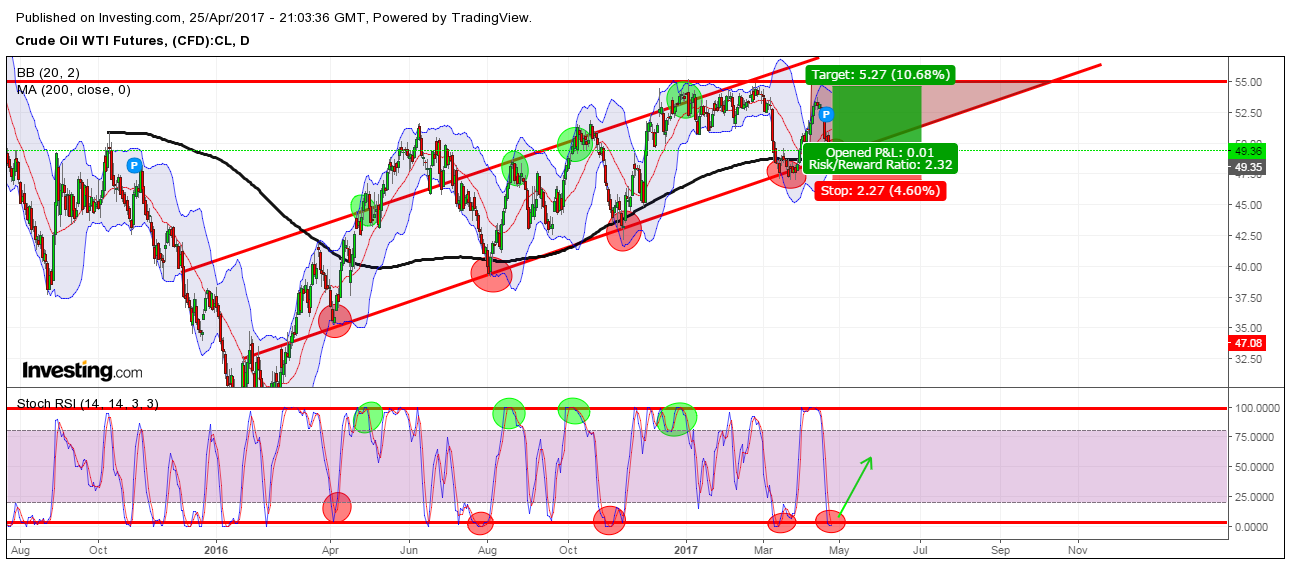
We can see at the chart the ascending channel which Crude Oil is moving since April 2016. There is a strong resistance at 54,50$-55$ level which is a target price and it has been predicted since the announcement of the O.P.E.C deal. 200MA in an upward trend .On a more long term view a rising triangle is formed that "has to break soon" it will be analyzed in another article soon. We have as support the lower Bollinger Band®, the well respected trend line and the 200MA. We also noticed some signs of fatigue as we failed to make higher highs and the RSI Stochastic went to overbought area relatively early inside the ascending channel but we are still bullish.
POSSIBLE TRADE WITH P/L RATIO 2,30:
FIRST POSSIBLE TARGET AT 53$ LEVEL
SECOND POSSIBLE TARGET AT 54,50$-55$ LEVEL
STOP LOSS AT 47$ UNDER 1)200MA,2)TREND-LINE,3)LOWER BAND
Thank you for time.
Happy trading!
Disclosure:
I/we have no positions on Crude Oil and no plans to initiate any positions the next 3 days.I wrote this article myself and it expresses my own opinions.


