
(T2108 measures the percentage of stocks trading above their respective 40-day moving averages [DMAs]. It helps to identify extremes in market sentiment that are highly likely to reverse. To learn more about it, see my T2108 Resource Page. You can follow real-time T2108 commentary on twitter using the #T2108 hashtag. T2108-related trades and other trades are posted on twitter using the #120trade hashtag)
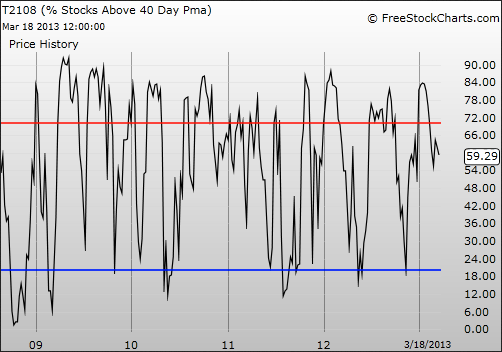
- T2108 Status: 59.3%
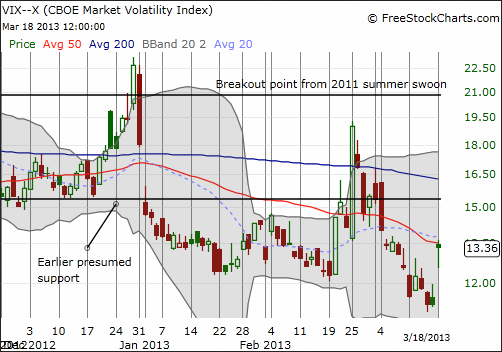
- VIX Status: 13.4
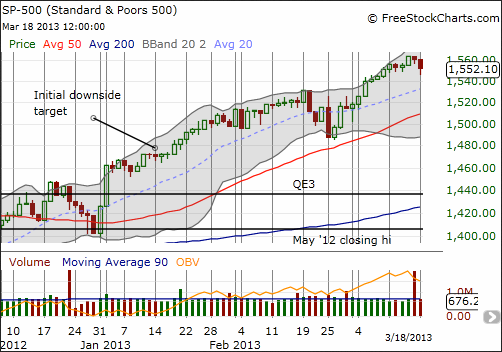
- General (Short-term) Trading Call: Hold
- S&P 500 or SPY
- SDS (ProShares UltraShort S&P500)
- U.S. Dollar Index (volatility index)
- VIX (volatility index)
- VXX (iPath S&P 500 VIX Short-Term Futures ETN)
- EWG (iShares MSCI Germany Index Fund)
- CAT (Caterpillar)
my last T2108 Update
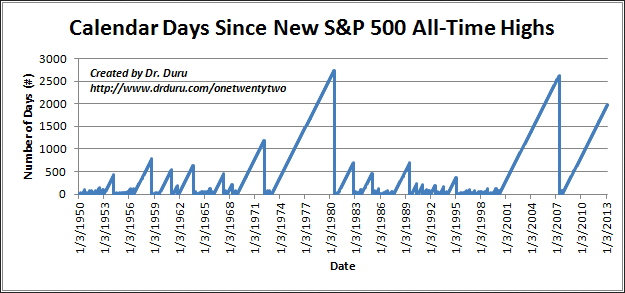
Poor Consumer Sentiment Underlines Poor Participation In Market Highs
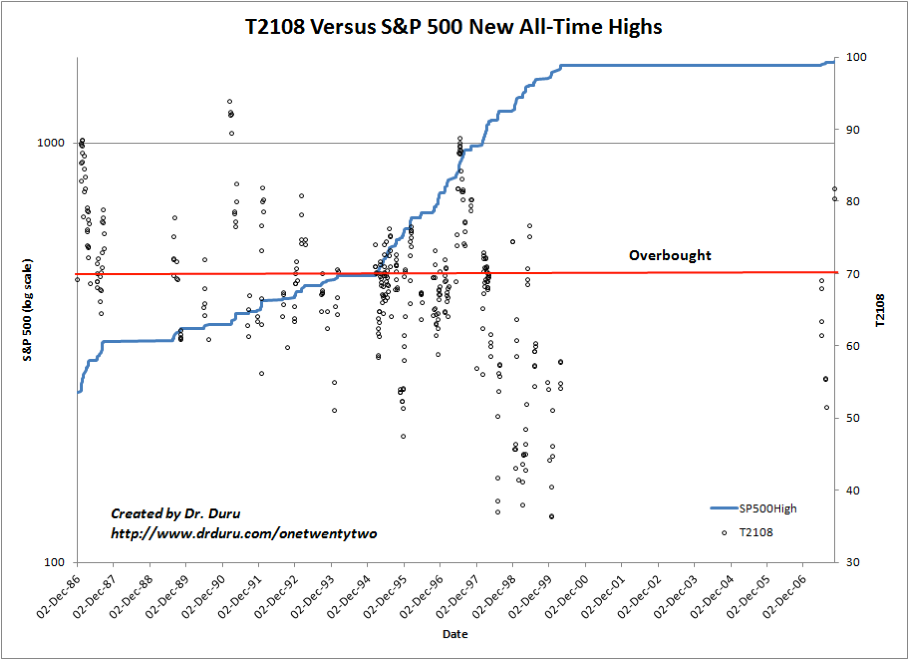
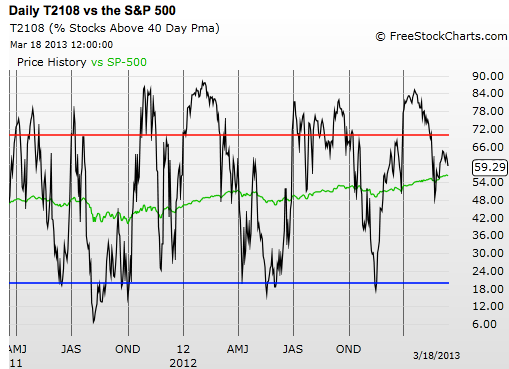
Black line: T2108 (measured on the right) -- Green line: S&P 500 (for comparative purposes) -- Red line: T2108 Overbought (70%); Blue line: T2108 Oversold (20%)
*All charts created using freestockcharts.com unless otherwise stated
Related links:
The T2108 Resource Page
Expanded daily chart of T2108 versus the S&P 500
Expanded weekly chart of T2108
Full disclosure: long VXX shares and puts