Get 40% Off
🚨 Volatile Markets? Find Hidden Gems for Serious OutperformanceFind Stocks Now

Systemax: Descending Triangle Bearish Continuation Chart Pattern

Published 05/21/2019, 09:00 AM
Updated 07/09/2023, 06:31 AM

Every week Tech Charts Global Equity Markets report features some of the well-defined, mature classical chart patterns under a lengthy watchlist and the chart pattern breakout signals that took place during that week. Global Equity Markets report covers single stocks from developed, emerging and frontier markets, ETF’s and global equity indices. The report starts with a review section that highlights the important chart developments on global equity benchmarks. This blog post features from the watchlist section SYSTEMAX INC., listed on the New York Stock Exchange.

SYSTEMAX INC (SYX)

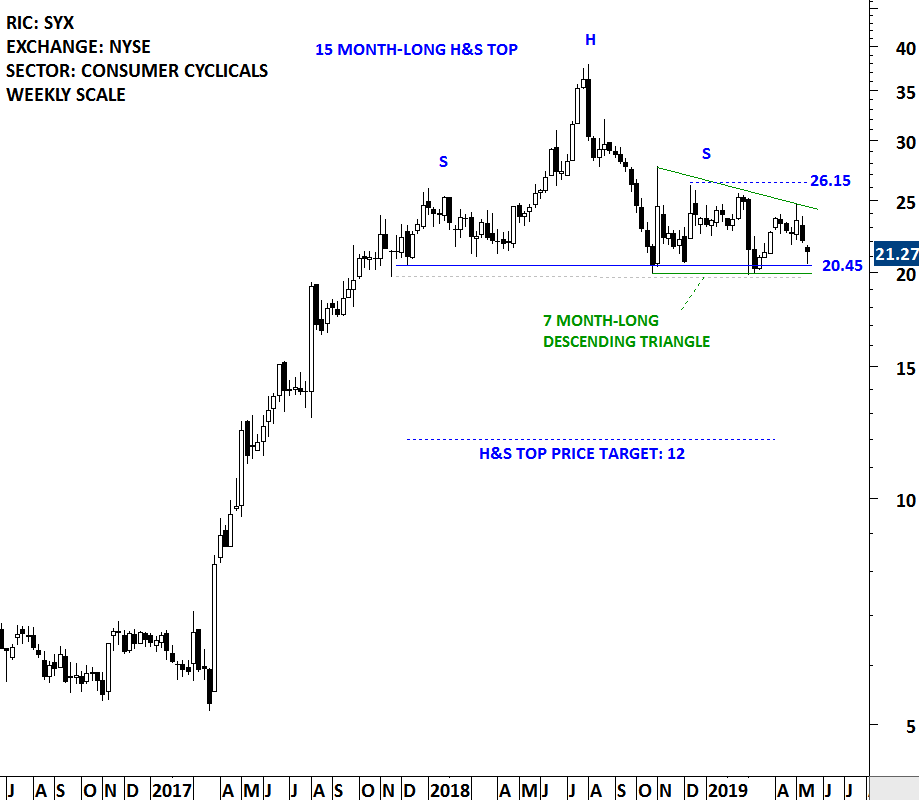
Systemax Inc (NYSE:SYX) is a direct marketer of brand name and private label products. The Company’s segments are Industrial Products Group (IPG), EMEA Technology Products Group (EMEA), and Corporate and Other (Corporate). The stock is listed on the New York Stock Exchange. Price chart formed a 15 month-long head and shoulder top with the horizontal boundary acting as strong support at 20.45 levels. The horizontal boundary was tested several times over the course of the chart pattern. The right shoulder of the H&S top can be identified as a possible 7 month-long descending triangle. The descending triangle is a bearish continuation chart pattern. A daily close below 19.75 levels will confirm the breakdown from the 15 month-long head and shoulder top with the possible chart pattern price target of 12.00 levels. A breach above the high of the right shoulder (26.15) can result in a H&S top failure and put the bearish interpretation in question.

Latest comments

Risk Disclosure: Trading in financial instruments and/or cryptocurrencies involves high risks including the risk of losing some, or all, of your investment amount, and may not be suitable for all investors. Prices of cryptocurrencies are extremely volatile and may be affected by external factors such as financial, regulatory or political events. Trading on margin increases the financial risks.
Before deciding to trade in financial instrument or cryptocurrencies you should be fully informed of the risks and costs associated with trading the financial markets, carefully consider your investment objectives, level of experience, and risk appetite, and seek professional advice where needed.
Fusion Media would like to remind you that the data contained in this website is not necessarily real-time nor accurate. The data and prices on the website are not necessarily provided by any market or exchange, but may be provided by market makers, and so prices may not be accurate and may differ from the actual price at any given market, meaning prices are indicative and not appropriate for trading purposes. Fusion Media and any provider of the data contained in this website will not accept liability for any loss or damage as a result of your trading, or your reliance on the information contained within this website.
It is prohibited to use, store, reproduce, display, modify, transmit or distribute the data contained in this website without the explicit prior written permission of Fusion Media and/or the data provider. All intellectual property rights are reserved by the providers and/or the exchange providing the data contained in this website.
Fusion Media may be compensated by the advertisers that appear on the website, based on your interaction with the advertisements or advertisers.
© 2007-2024 - Fusion Media Limited. All Rights Reserved.