
Synchrony Financial’s (NYSE:SYF) fourth-quarter 2017 earnings per share of 70 cents surpassed the Zacks Consensus Estimate by 11.1%. The bottom line remained flat year over year.
Including the impact of the tax act that resulted in $160 million of additional tax expenses, net earnings totaled $385 million. This reflects 33% decline from the prior-year quarter.
For 2017, earnings per share came at $2.62, down 3.3% from 2016.
Results in Detail
The company’s net interest income increased 8% to $3.9 billion in the fourth quarter, primarily due to strong loan receivables growth. For 2017, net interest income grew 11% to $15 billion from the prior year.
However, other income was down 27% to $65 million, primarily due to higher loyalty program expenses, partially offset by higher interchange revenues.
Loan receivables grew 7% year over year to $82 billion.
Deposits were $56 billion, up 9% from the last-year quarter.
Purchase volume increased 3% from the fourth quarter of 2016 to $37 billion.
Provision for loan losses increased 26% year over year to $1.4 billion due to credit normalization.
Total other expenses increased 6% to $970 million, primarily due to business growth and marketing expenses.
Sales Platforms Update
Retail Card
Interest and fees on loans grew 8% year over year, driven primarily by period-end loan receivables growth of 7%.
Purchase volume growth was 3% and average active account rose 3%.
Loan receivables growth was broad-based across partner programs.
Payment Solutions
Interest and fees on loans rose 10% year over year on the back of period-end loan receivables growth of 8%.
Purchase volume growth was 9%, adjusted to exclude the impact of the hhgregg bankruptcy, and 7% rise in average active account.
Loan receivables growth was led by home furnishings and automotive.
CareCredit
Interest and fees on loans increased 8% year over year, driven by period-end loan receivables growth of 10%.
Purchase volume growth was 8% and average active account growth was 8%.
Loan receivables growth was led by dental and veterinary.
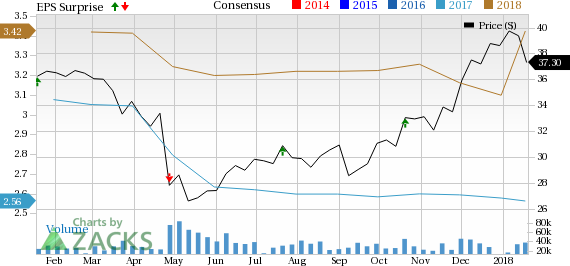
Synchrony Financial Price, Consensus and EPS Surprise
Financial Position
Total assets as on Dec 31, 2017 was $95.8 billion, up 6.2% year over year.
Total borrowings as on Dec 31, 2017, was $20.8 billion, up 3.2% year over year.
The company’s balance sheet remained strong during the quarter, with total liquidity of $21 billion, or 22% of total assets.
Return on assets was 1.6% and return on equity was 10.5%, including the impact of the tax act.
Efficiency ratio was 30.3% compared with 31.6% in the fourth quarter of 2016, driven by strong positive operating leverage.
Share Repurchase and Dividend Update
In the fourth quarter, the company paid quarterly common stock dividend of 15 cents per share and repurchased $430 million of Synchrony Financial common stock.
Zacks Rank
Synchrony Financial carries a Zacks Rank #3 (Hold). You can see the complete list of today’s Zacks #1 Rank (Strong Buy) stocks here.
Performance of Other Insurers
Among other players in the Finance sector that have reported their fourth-quarter earnings so far, Bank of America (NYSE:BAC) Corporation (NYSE:C) , Citigroup Inc. (NYSE:C) and U.S. Bancorp (NYSE:USB) beat their respective Zacks Consensus Estimate.
Will You Make a Fortune on the Shift to Electric Cars?
Here's another stock idea to consider. Much like petroleum 150 years ago, lithium power may soon shake the world, creating millionaires and reshaping geo-politics. Soon electric vehicles (EVs) may be cheaper than gas guzzlers. Some are already reaching 265 miles on a single charge.
With battery prices plummeting and charging stations set to multiply, one company stands out as the #1 stock to buy according to Zacks research.
It's not the one you think.
See This Ticker Free >>
U.S. Bancorp (USB): Free Stock Analysis Report
Citigroup Inc. (C): Free Stock Analysis Report
Bank of America Corporation (BAC): Free Stock Analysis Report
Synchrony Financial (SYF): Free Stock Analysis Report
Original post