Electronic vehicle (EV) charging network Switch (NYSE:SWCH) stock has surged on the electric vehicle (EV) momentum. The dizzying rate of money rotating from the heavily speculated EV stocks to speculative battery, materials and battery charging stocks can have your head spinning. Switch Bank Energy went public by merging into a special purpose acquisition company (SPAC). The Company was formerly known as ChargePoint founded in 2007. It has grown as the largest online network of independently owned EV charging stations operating in 14 countries. In September 2019, the Company had 115,000 charging stations and is adding 2,000 stations a month to its network with 2.5 million stations estimated by 2025. For those investors who are seeking a legit operating EV charging network infrastructure play, Switch Back is the real deal. The growing hype surrounding SPACs can be blinding making it difficult to determine the actual operating companies from the “hype” speculative proof of concept/prototype entities. Prudent investors looking to seek exposure in a legit EV charging infrastructure play can watch for opportunistic pullback price levels to gain exposure in shares of Switch Back.
Switch Back Energy Narrative
The Company, formerly ChargePoint, has a 73% market shares of L2 charging stations which is 7X the closest competitor, according to its Investor Presentation September 2020. It is the “#1 brand in North America”. The Company makes 80% of its revenues from charging and 20% from recurring subscriptions. The network works with any EV vehicle including Tesla (NASDAQ:TSLA) vehicles. The Company also provides both cloud-based commercial plans and home charging kits under the ChargePoint brand further embedding its brand.
Growth Prospects
ChargePoint top-line sales grew 60% year-over-year (YoY) in 2019. The Company estimates 60% compound annual growth rate (CAGR) from 2021 to 2026 with over $1 billion in revenues at just 3% EV penetration by 2025 and nearly 10% EV penetration by 2026 with over $1.5 billion in revenues. ChargePoint also notes additional tailwinds to include fossil-fuel bans (as implied by the Biden administration), transit electronification dates, federal and state incentive programs, all major OEM brands committed to electronification of vehicles, and further cost reductions with advances in battery technology. The Company has existed for 13-years but has finally hit its stride as a real deal legit EV charging network.
First to Market Advantage
ChargePoint CEO Scott McNeill summed it up:
“The EV charging industry is accelerating and it is expected that charging infrastructure investment will be $190 billion by 2020. As a first-mover in the space, ChargePoint has distinguished itself as the #1 EV charging infrastructure as the expected transition to electric mobility accelerates.”
The Green EV Wave
The aged of the EV is upon us and hitting on all cylinders as far the hype cycle is concerned. The blinding rate of SPACs has also surged as the posers, perpetrators get mixed in with the real deal players. President-elect Joe Biden has made it clear that the fossil fuel industry is on its way out as clean energy and eco-friendly vehicles are at the top of the agenda. ChargePoint is one of the rare “real deals” that has come to market through a SPAC reverse merger, not to be confused with prototypes that have “promising” futures and growth prospects. Prudent investors seeking a material function and operating EV charging play can watch for opportunistic pullback levels in SBE shares.

SBE Opportunistic Pullback Levels
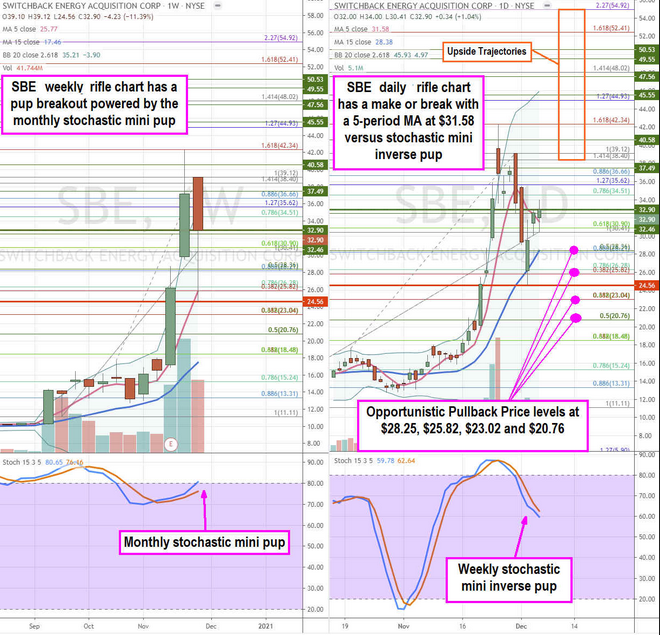
Using the rifle charts on the weekly and daily time frames provides the near-term perspective of the playing field for SBE stock. The weekly rifle chart formed a double-barreled pup breakout comprised of the moving average (MA) pup and stochastic mini pup peaking off the $39.12 Fibonacci (fib) level. The daily market structure low (MSL) triggers above $32.90. However, the daily market structure high (MSH) triggers under $24.56.
The daily rifle chart peaked out after tagging the $42.34 fib crossing down the daily stochastic as it leaned back to the daily 5-period MA at $31.58. This sets up a daily make or break formation where a stochastic cross up forms a daily pup breakout towards its upper Bollinger Bands (BBs) near the $44.93 fib or a channel tightening lower on a daily stochastic mini inverse pup.
A daily mini inverse pup can set-up opportunistic pullback levels at the $28.25 fib, $25.82 fib, $23.04 fib and the $20.76 fib. Prudent investors should wait for pullbacks as the current EV craze has propelled shares to lofty valuations. The upside trajectories range from the $38.40 fib upwards to the $54.92 based on the lasting momentum.
